Spatial analysis
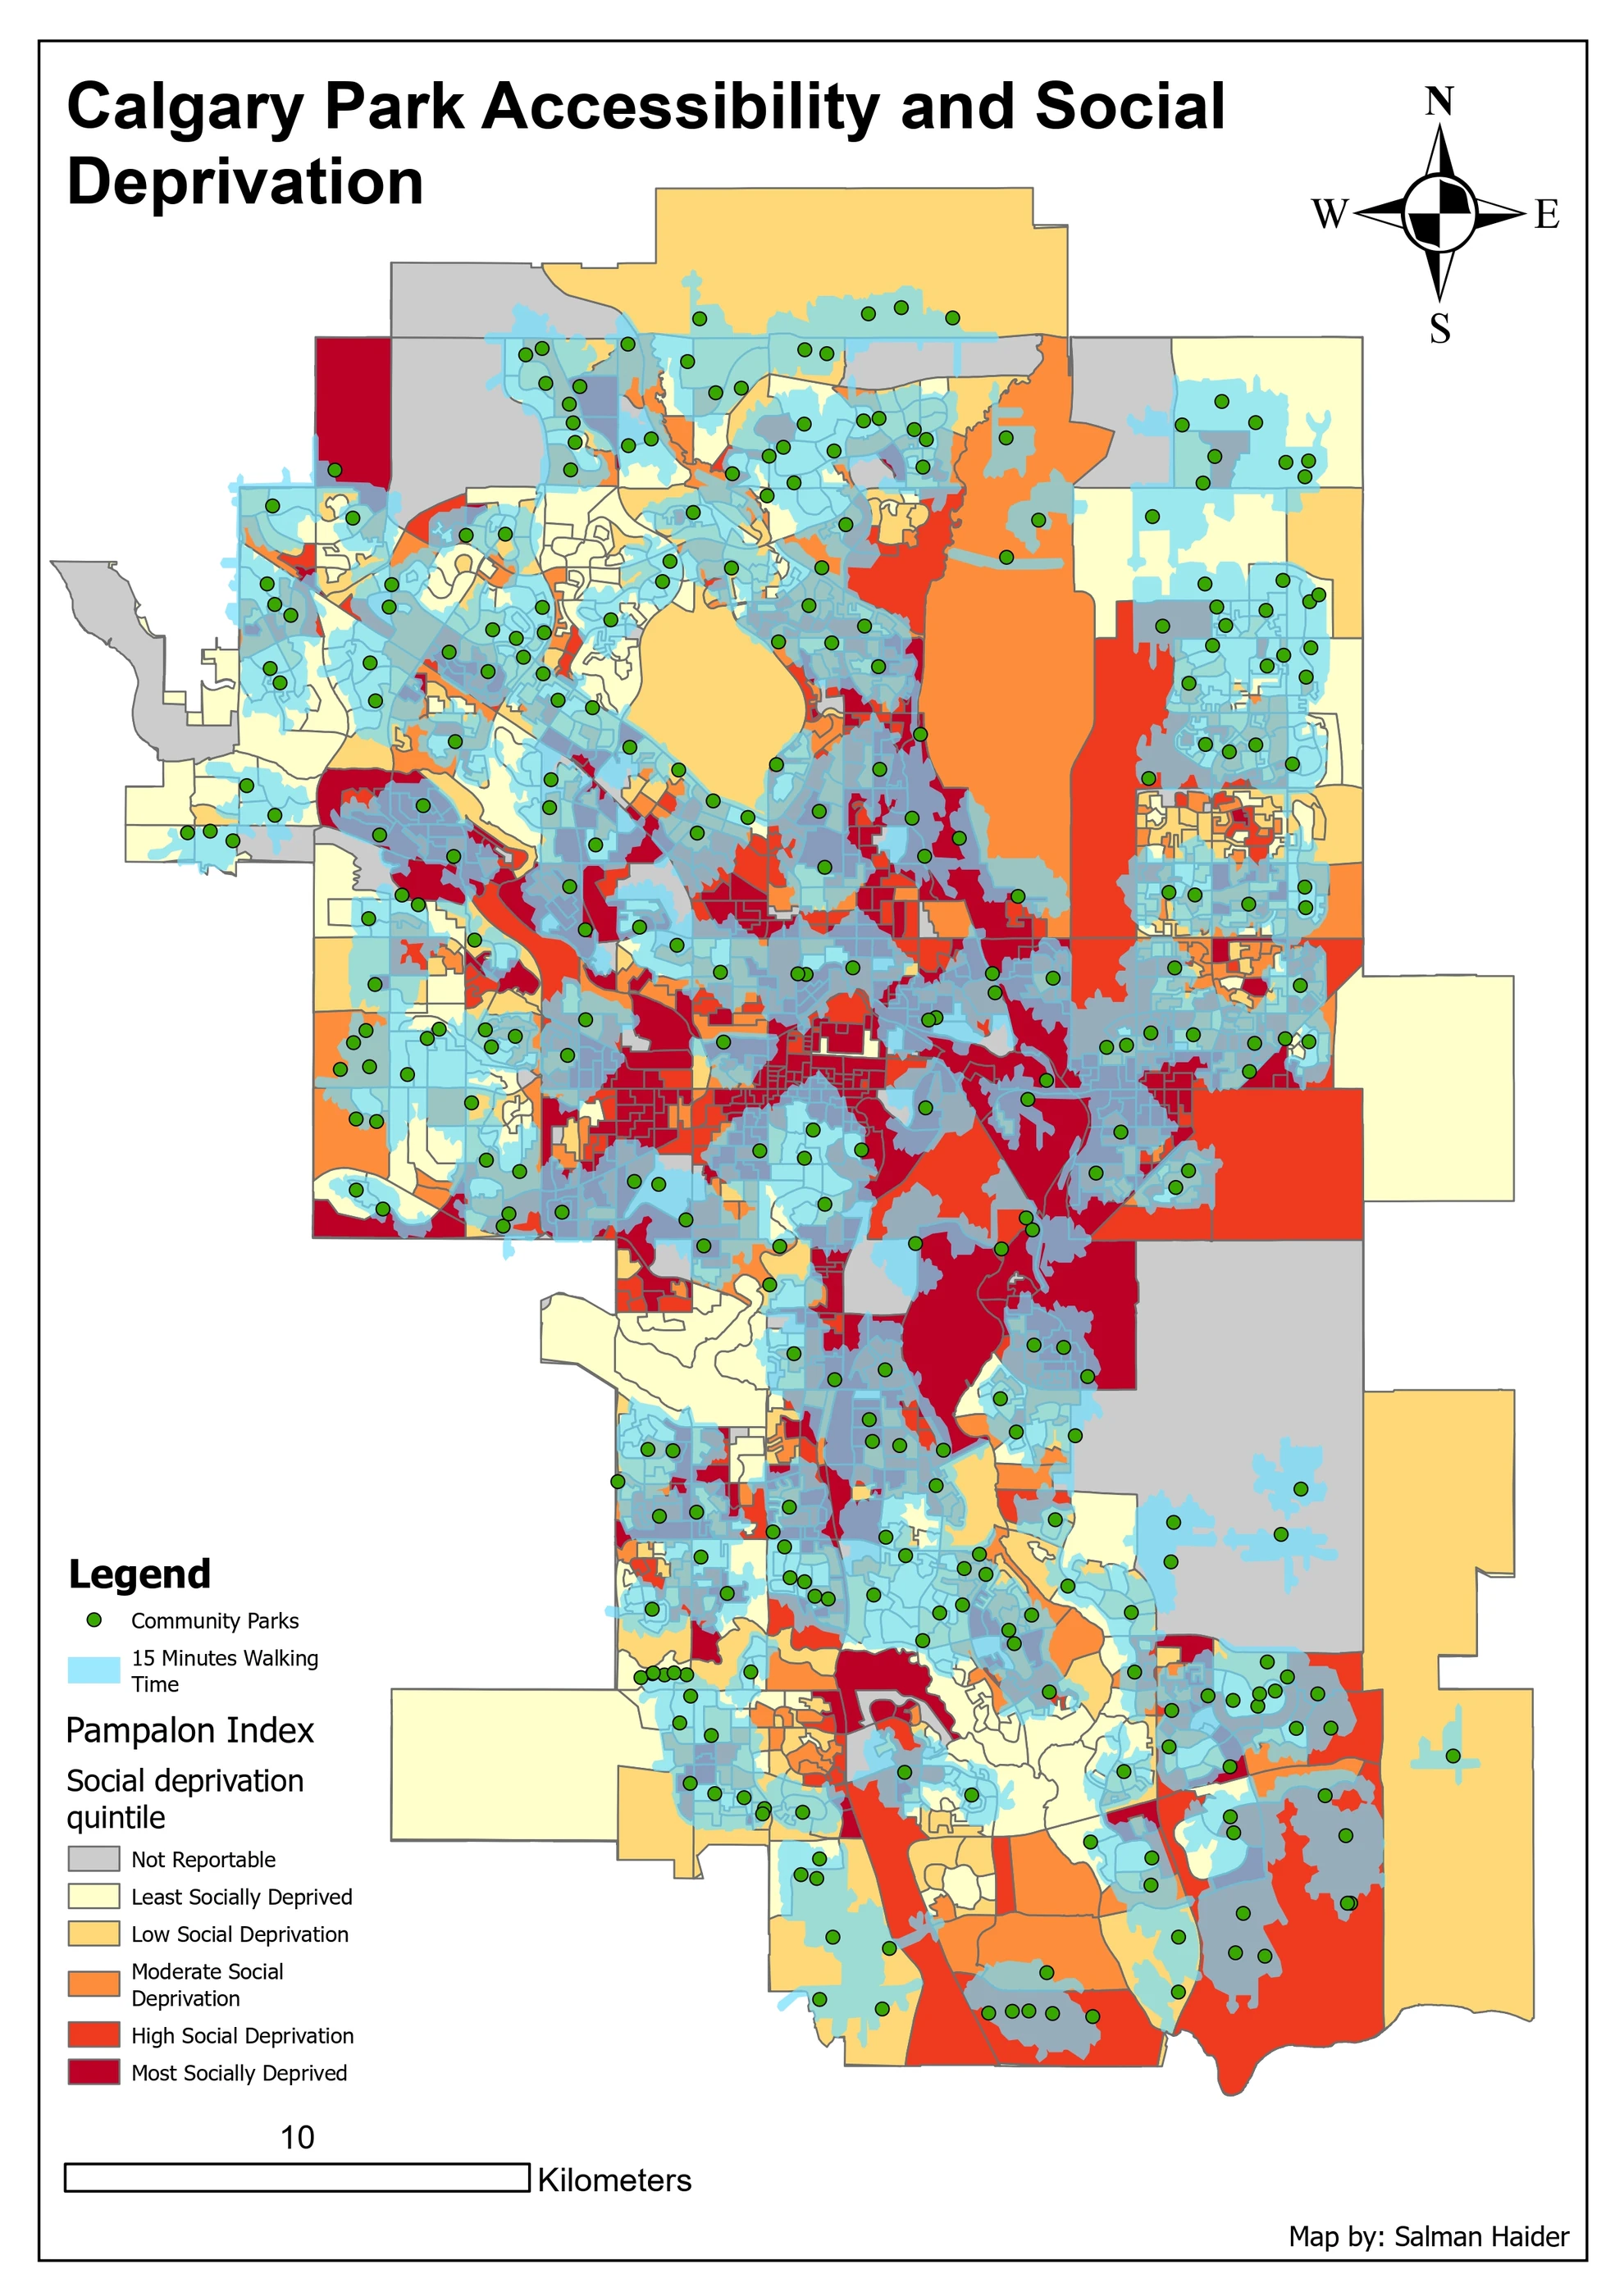
Calgary park access
I examined who was outside a 15 minute walk from a community park and tested where one new park could help.
Read the project: Calgary park accessMaps, analysis and tools I’ve made. Each project includes the approach, the result and what I would keep in mind when using it.
18 projects
Spatial analysis
I examined who was outside a 15 minute walk from a community park and tested where one new park could help.
Read the project: Calgary park accessCode & tools
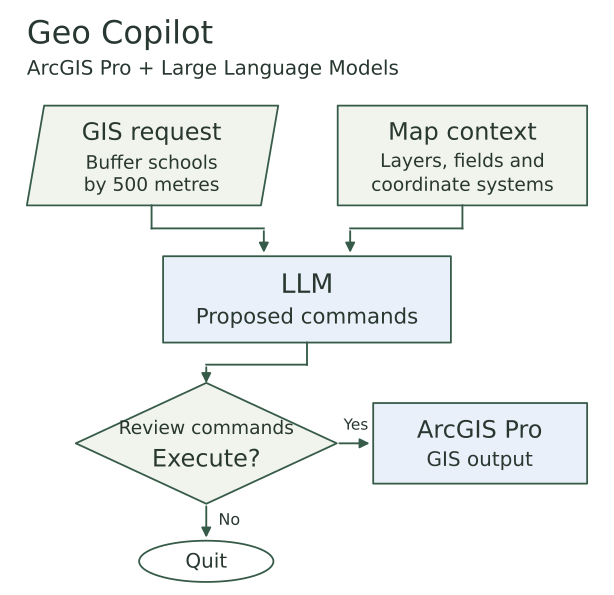
I built an ArcGIS Pro tool that uses Large Language Models (LLMs) to turn written requests into geoprocessing commands, with a review window before execution.
Read the project: Geo CopilotSpatial analysis
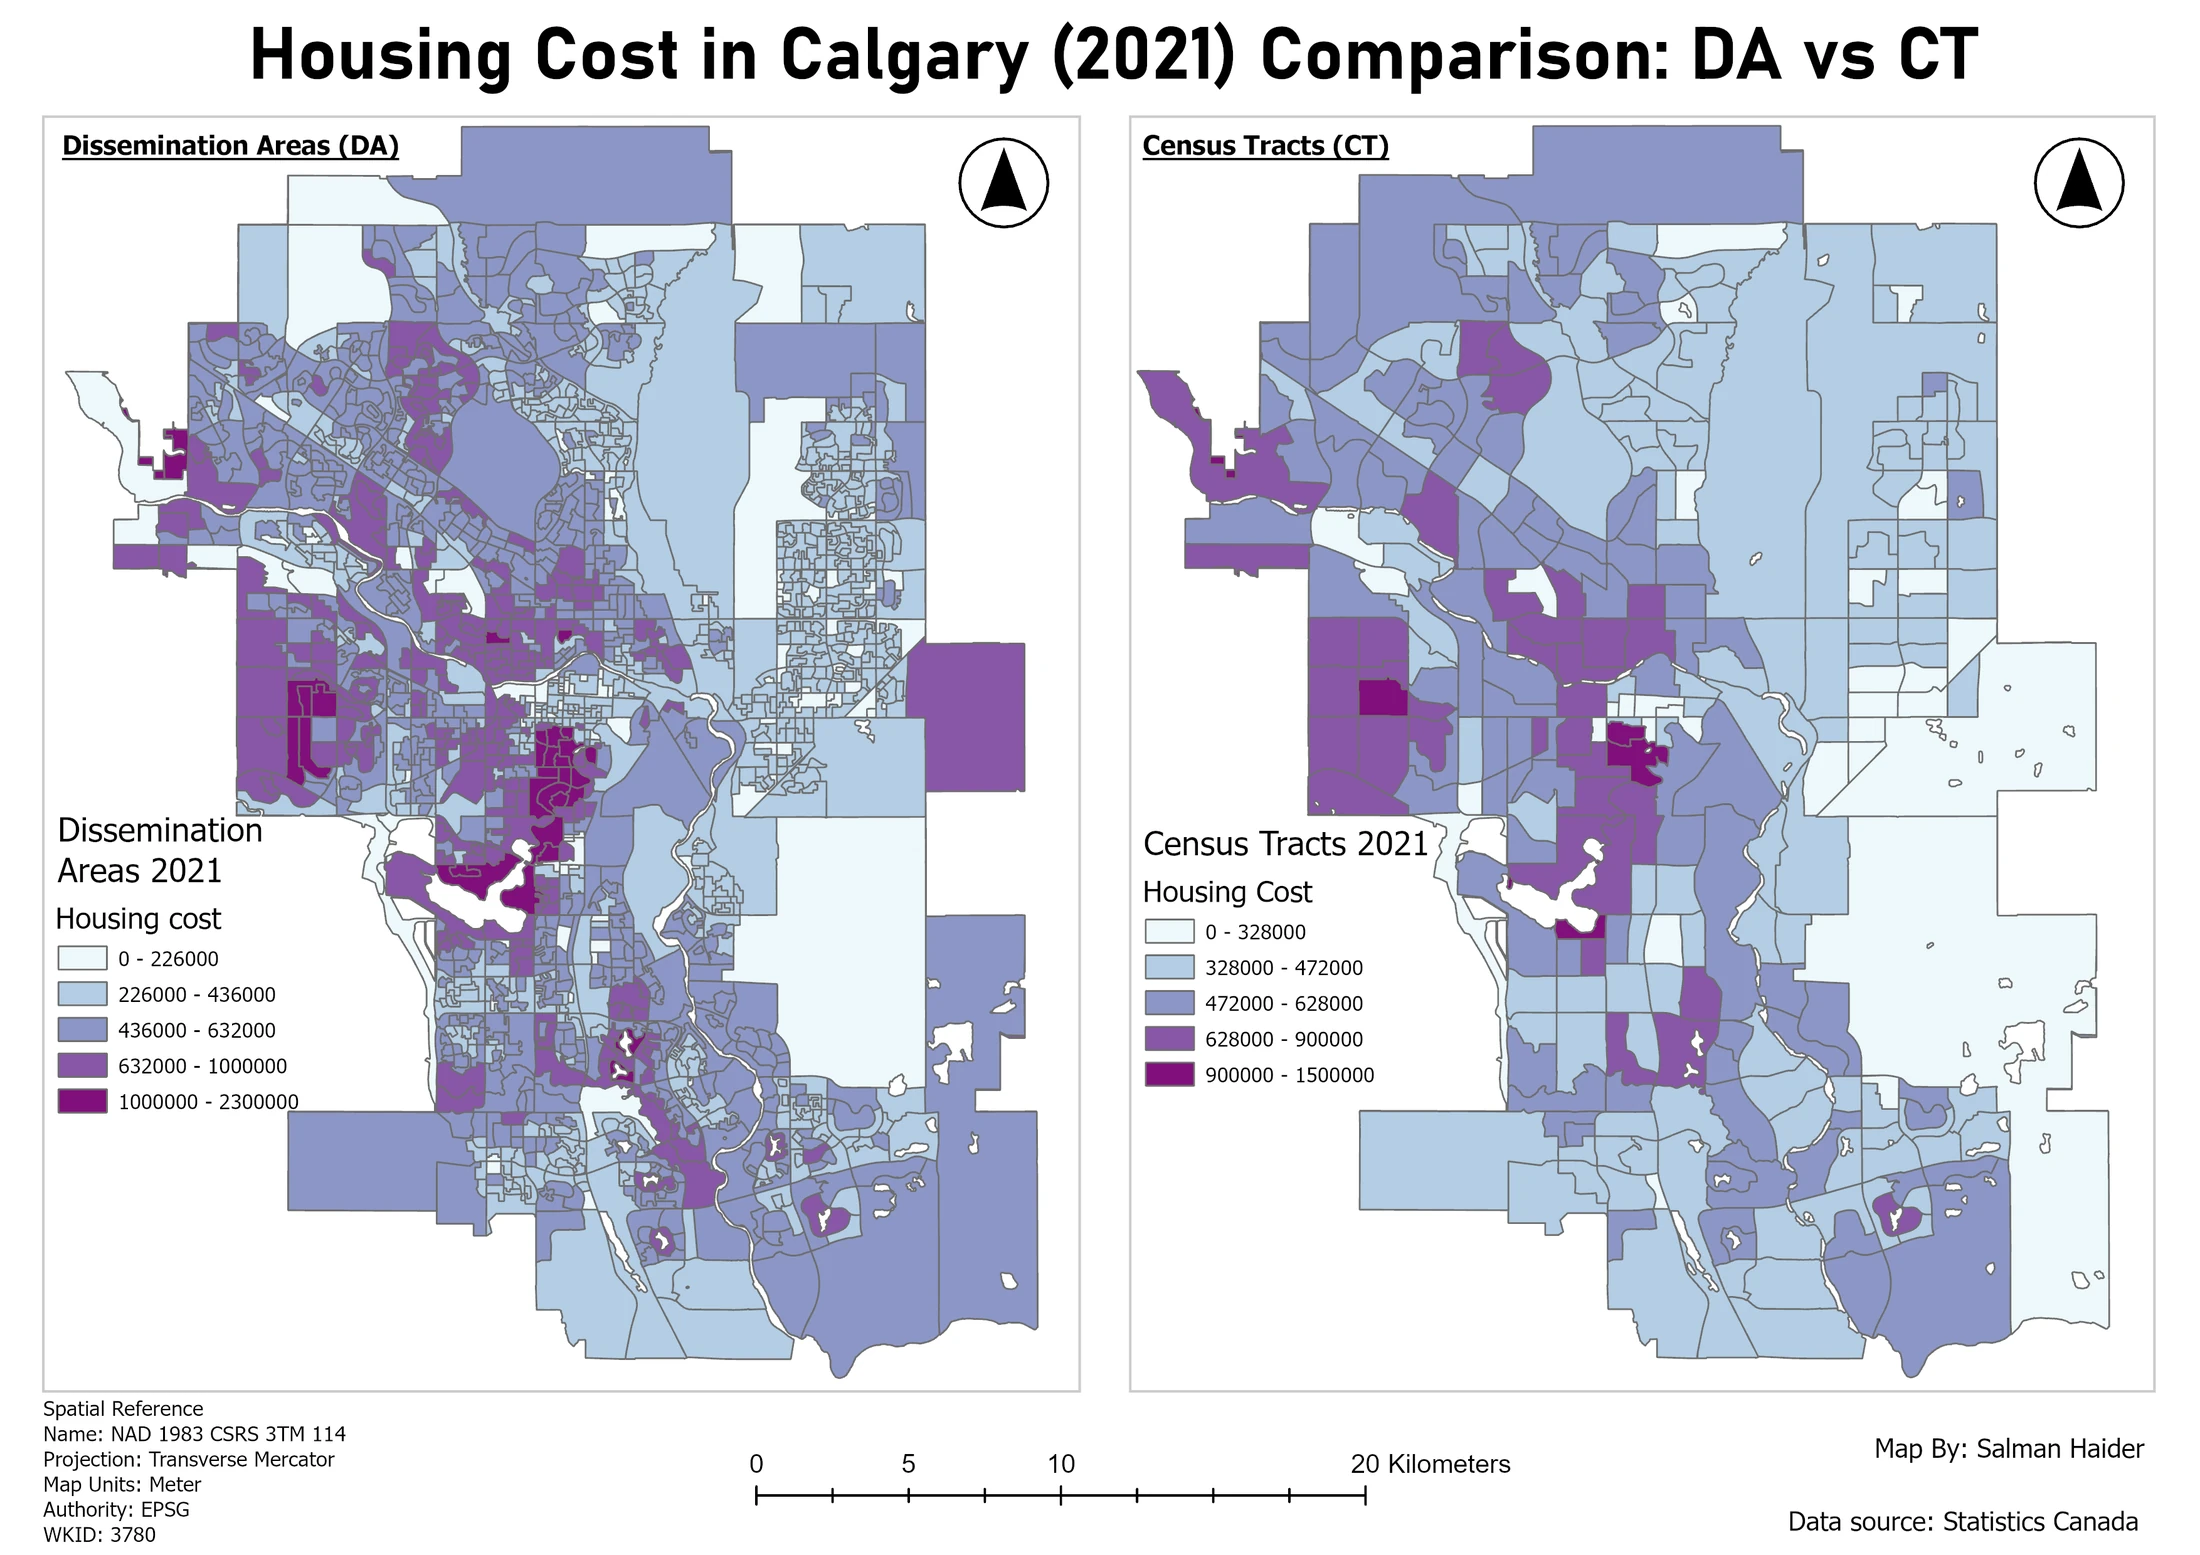
I compared Calgary housing costs and income across two census years to see where costs were highest and how geography affected the picture.
Read the project: Calgary housing patternsCode & tools
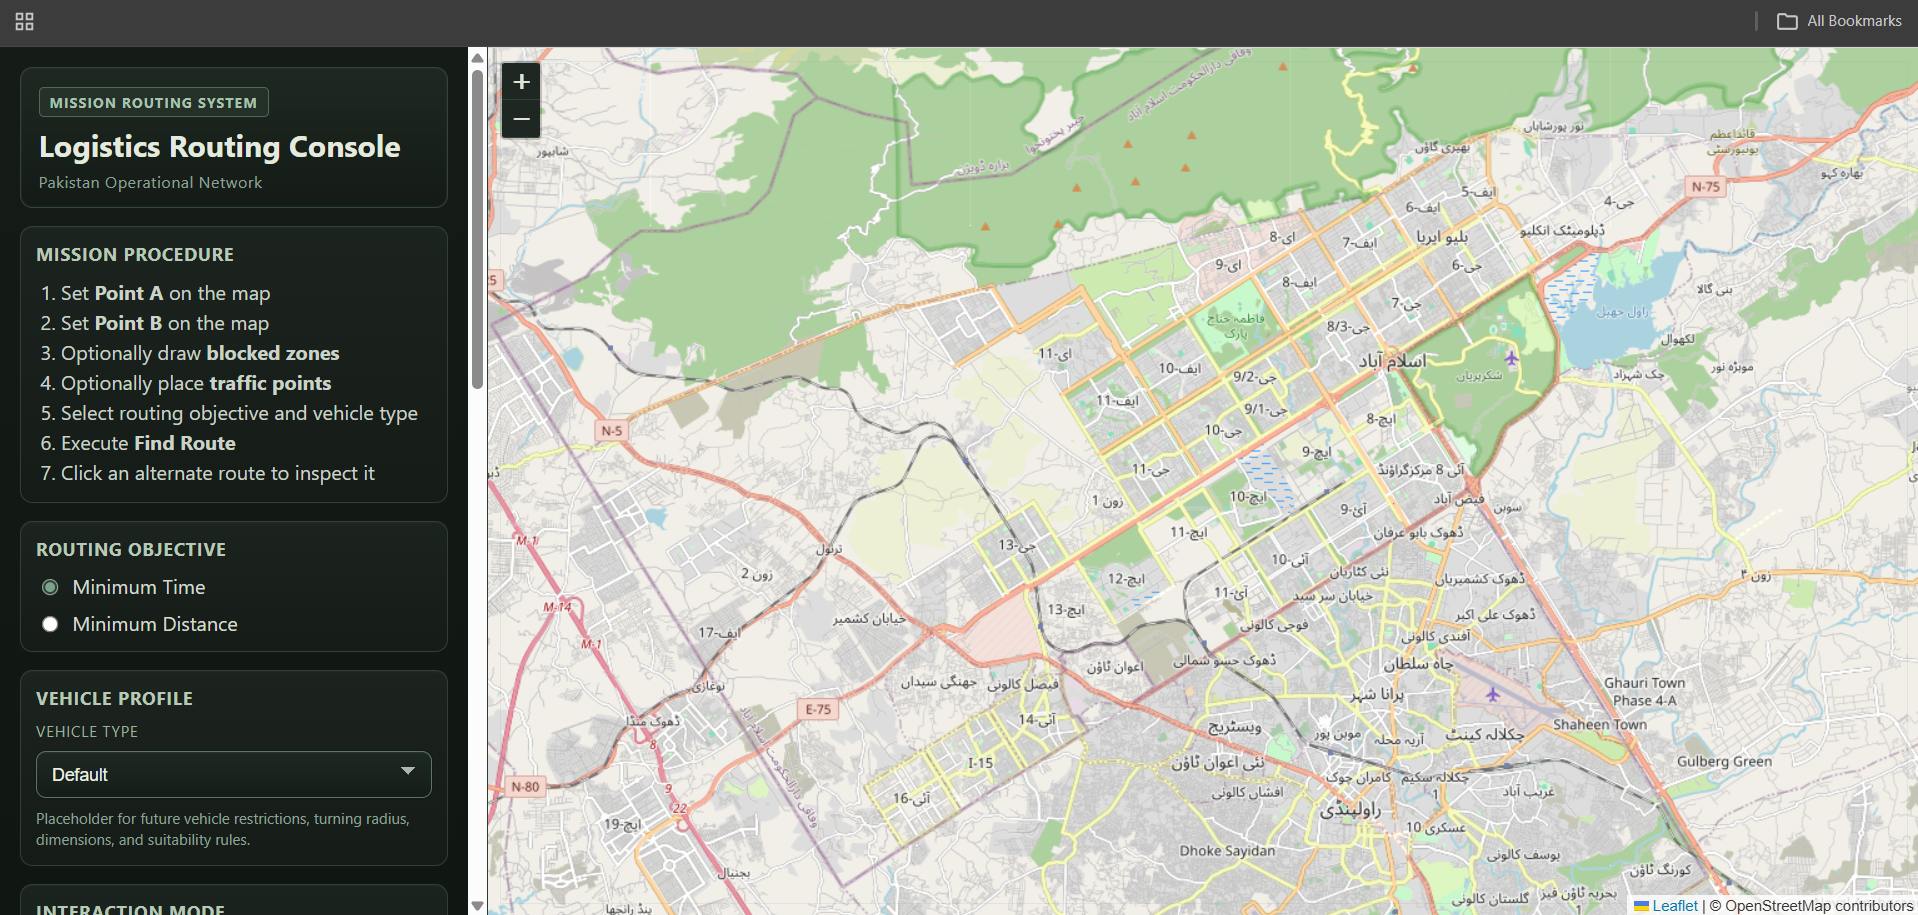
A routing prototype for comparing time, distance and alternative journeys when part of the road network is blocked.
Read the project: Logistics RoutingCartography
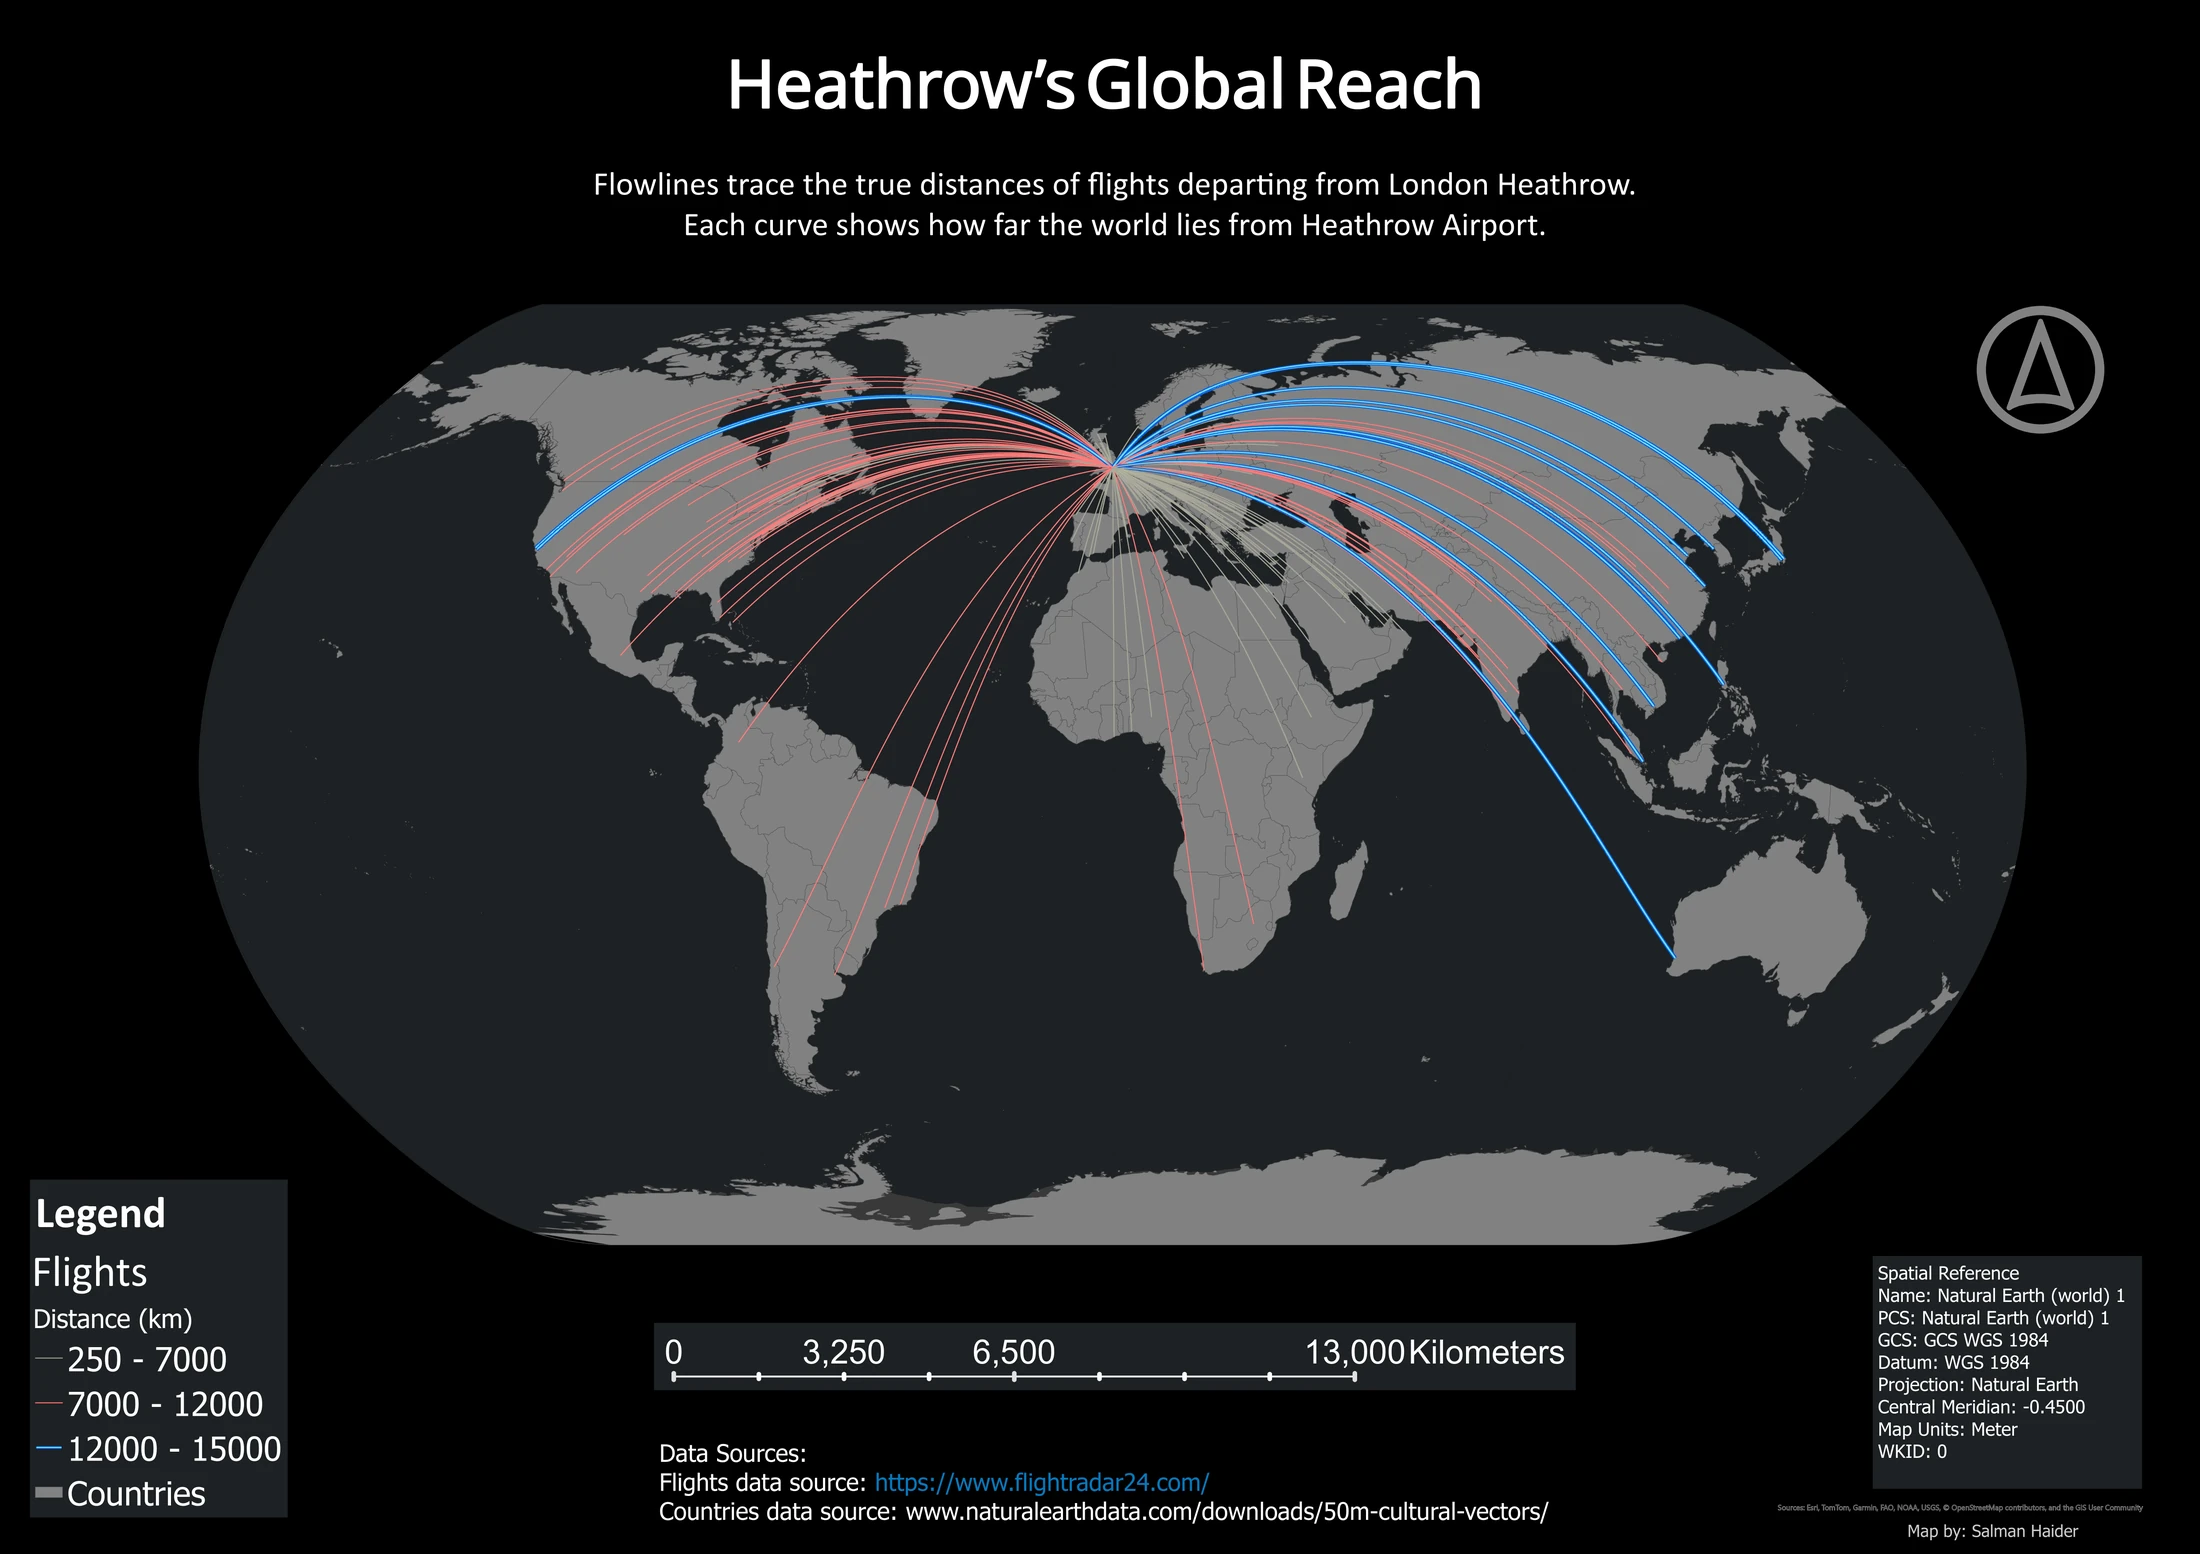
I turned a day of Heathrow flight records into two maps for a travel audience, showing worldwide reach and North American destinations.
Read the project: Heathrow connectionsCartography
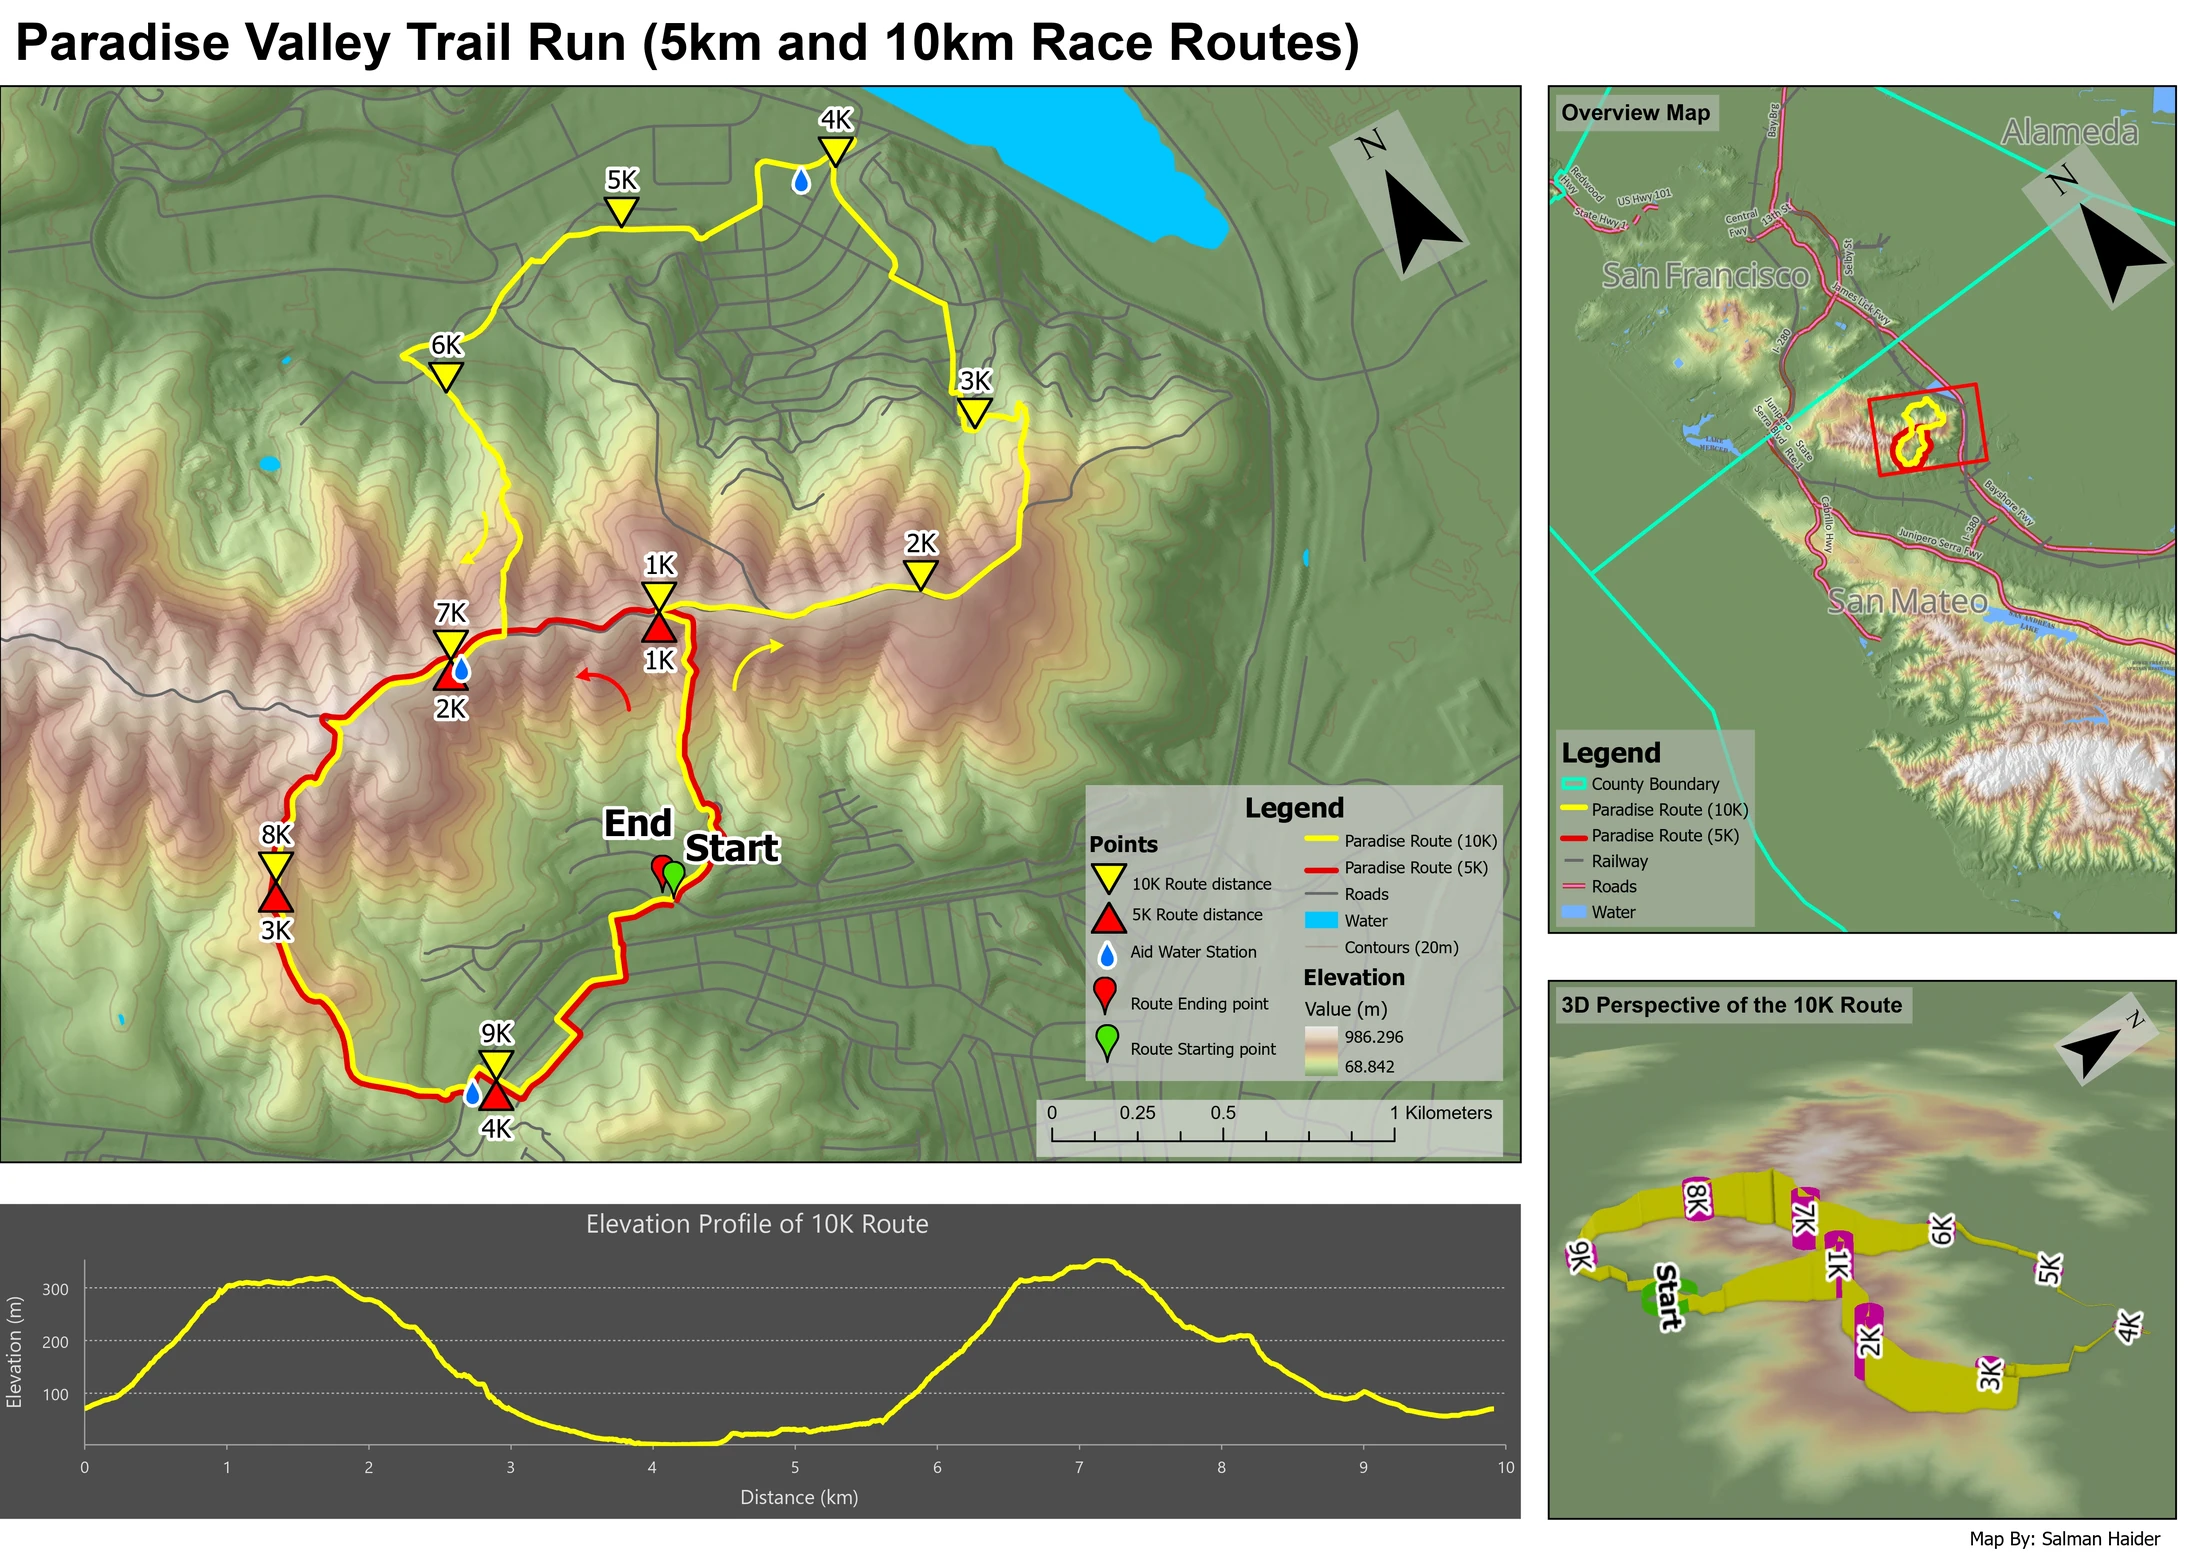
I combined a route map with terrain and an elevation profile so runners could understand the climbs as well as the course.
Read the project: Paradise Valley trail mapCartography
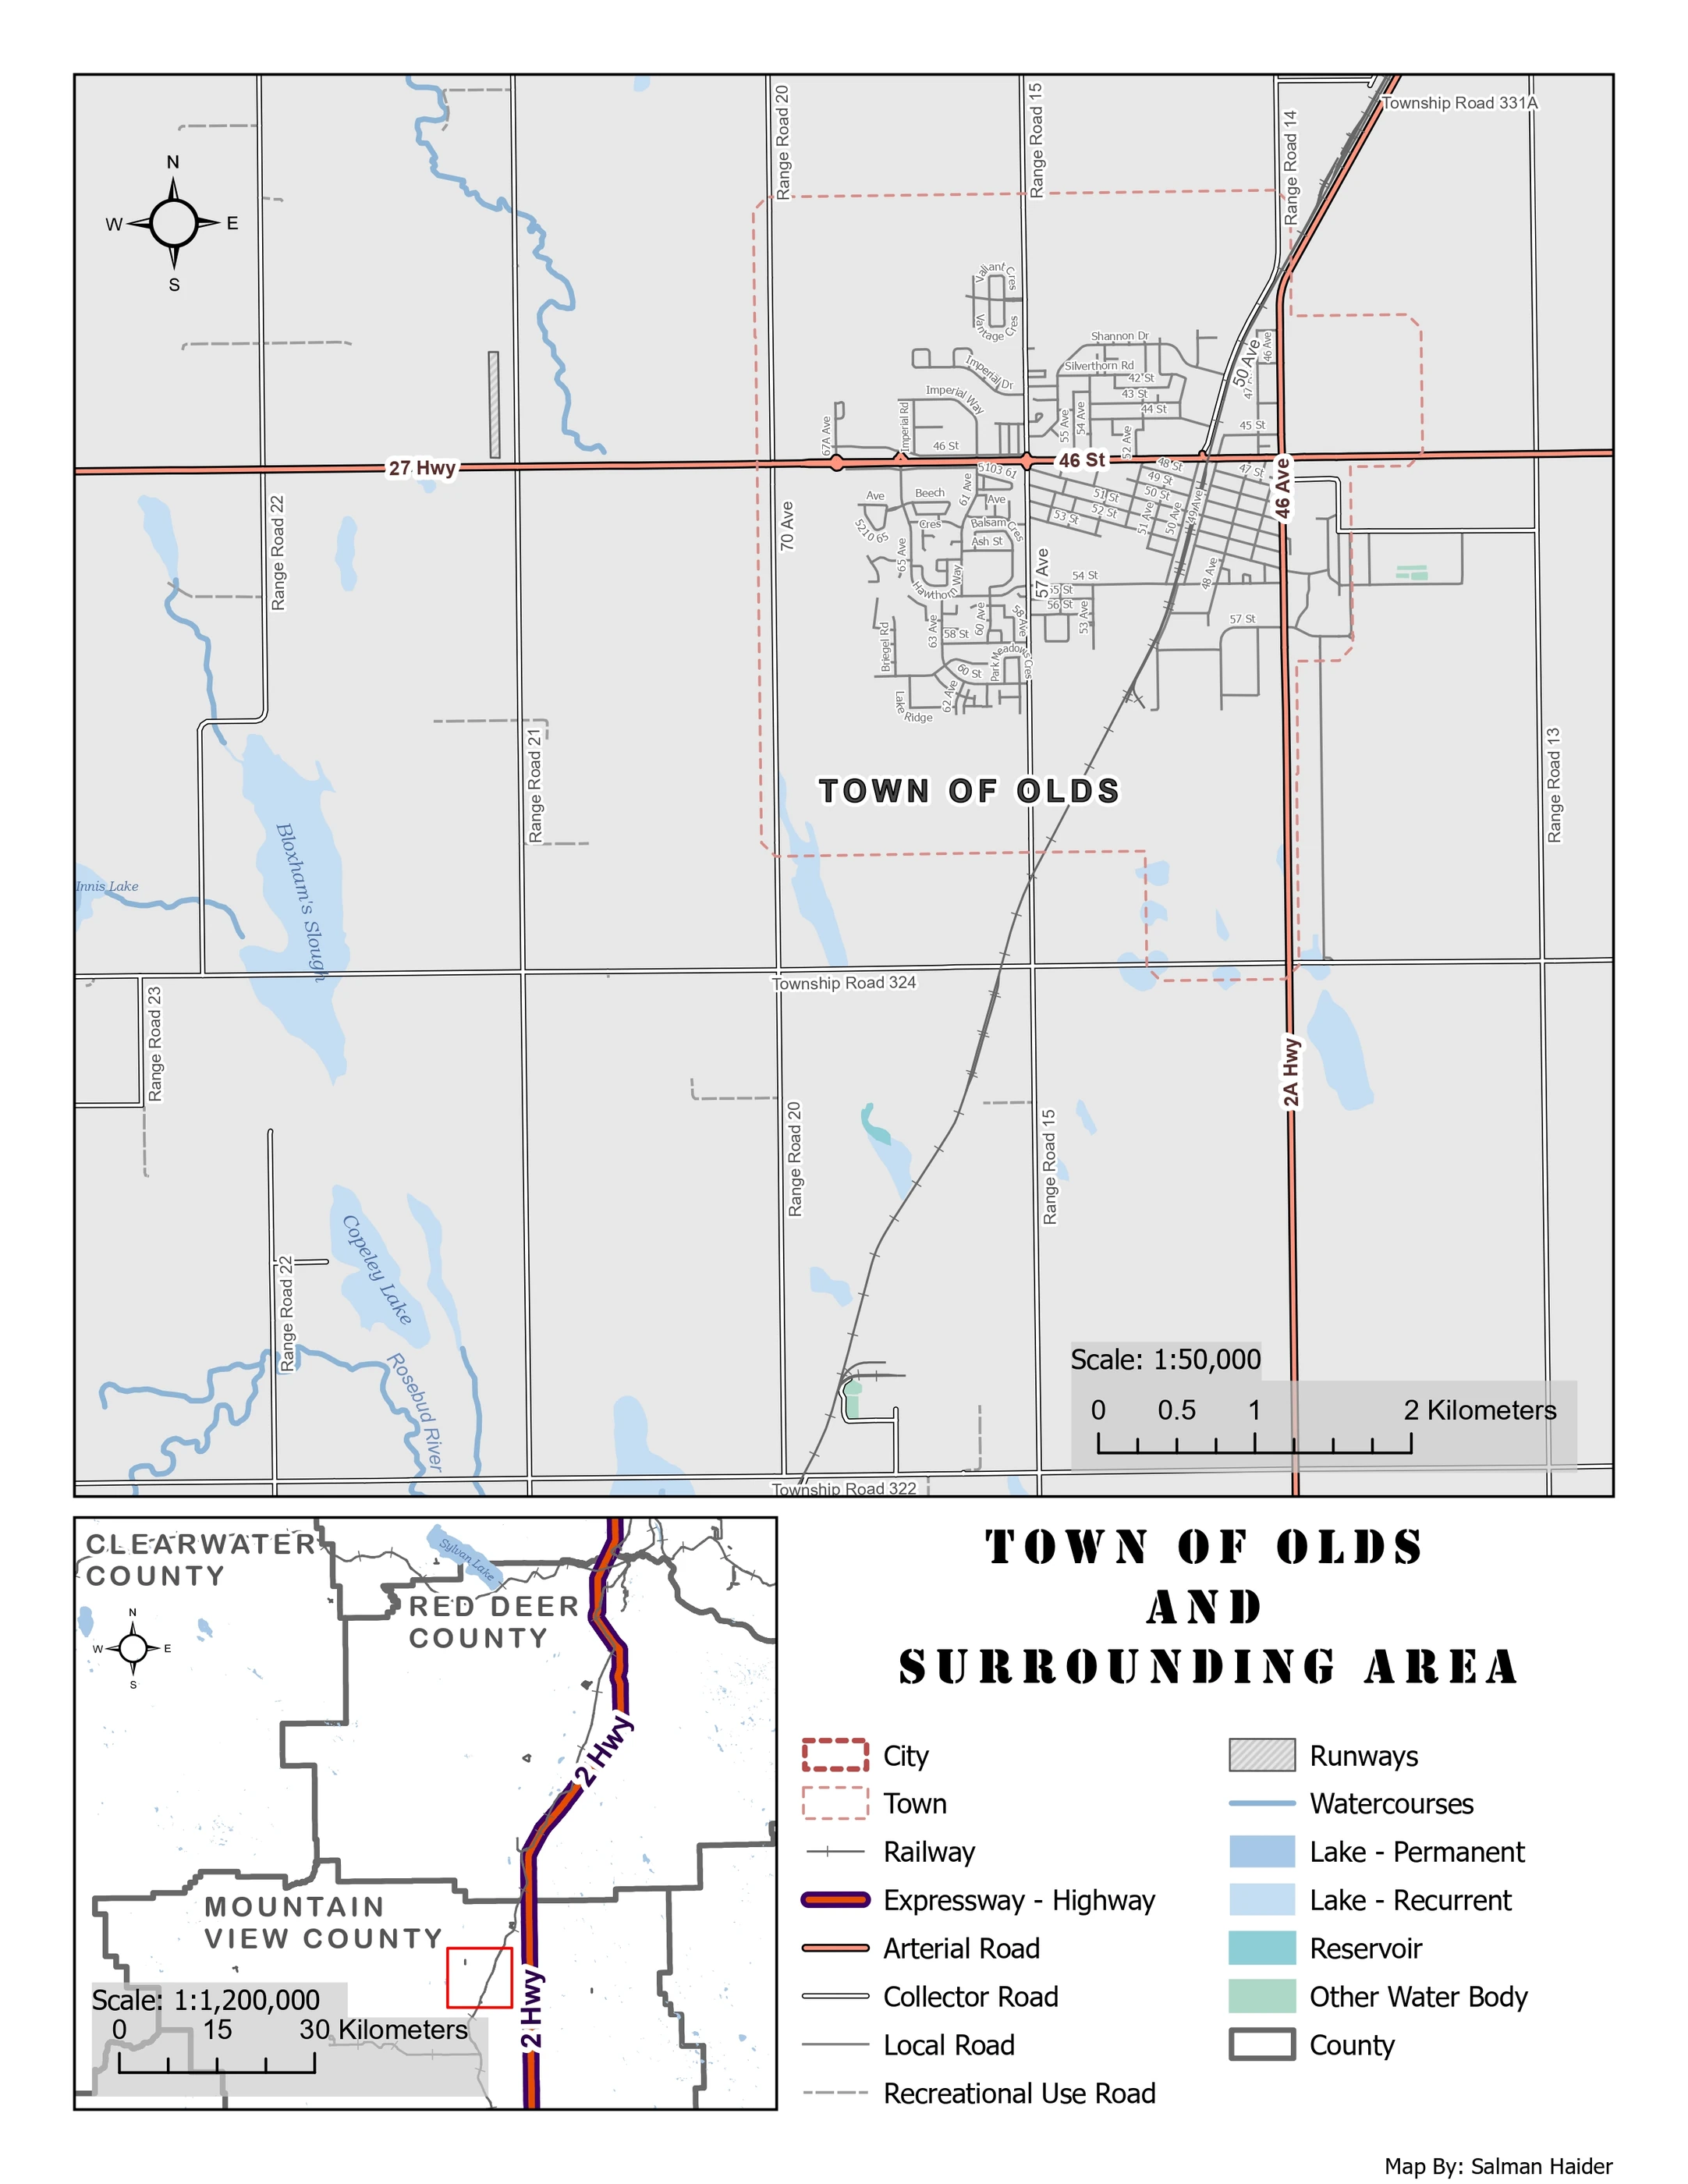
I made a reference map for residents and visitors to locate Olds, its main roads and the surrounding landscape.
Read the project: Town of Olds reference mapCode & tools
A toolbox for comparing a list of direct flight paths with road journeys, including range, payload and reporting checks.
Read the project: Drone Route ReportingCode & tools
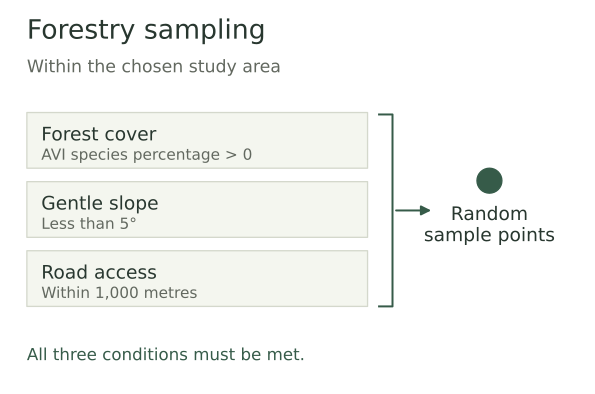
A field planning tool that generates candidate forest sampling points within a study area, using slope and road proximity criteria.
Read the project: Forestry Sampling Point GeneratorCode & tools
An Earth Engine workflow that turns Sentinel 2 imagery into a map and a table of average vegetation index values for city polygons.
Read the project: NDVI Zonal StatisticsCartography
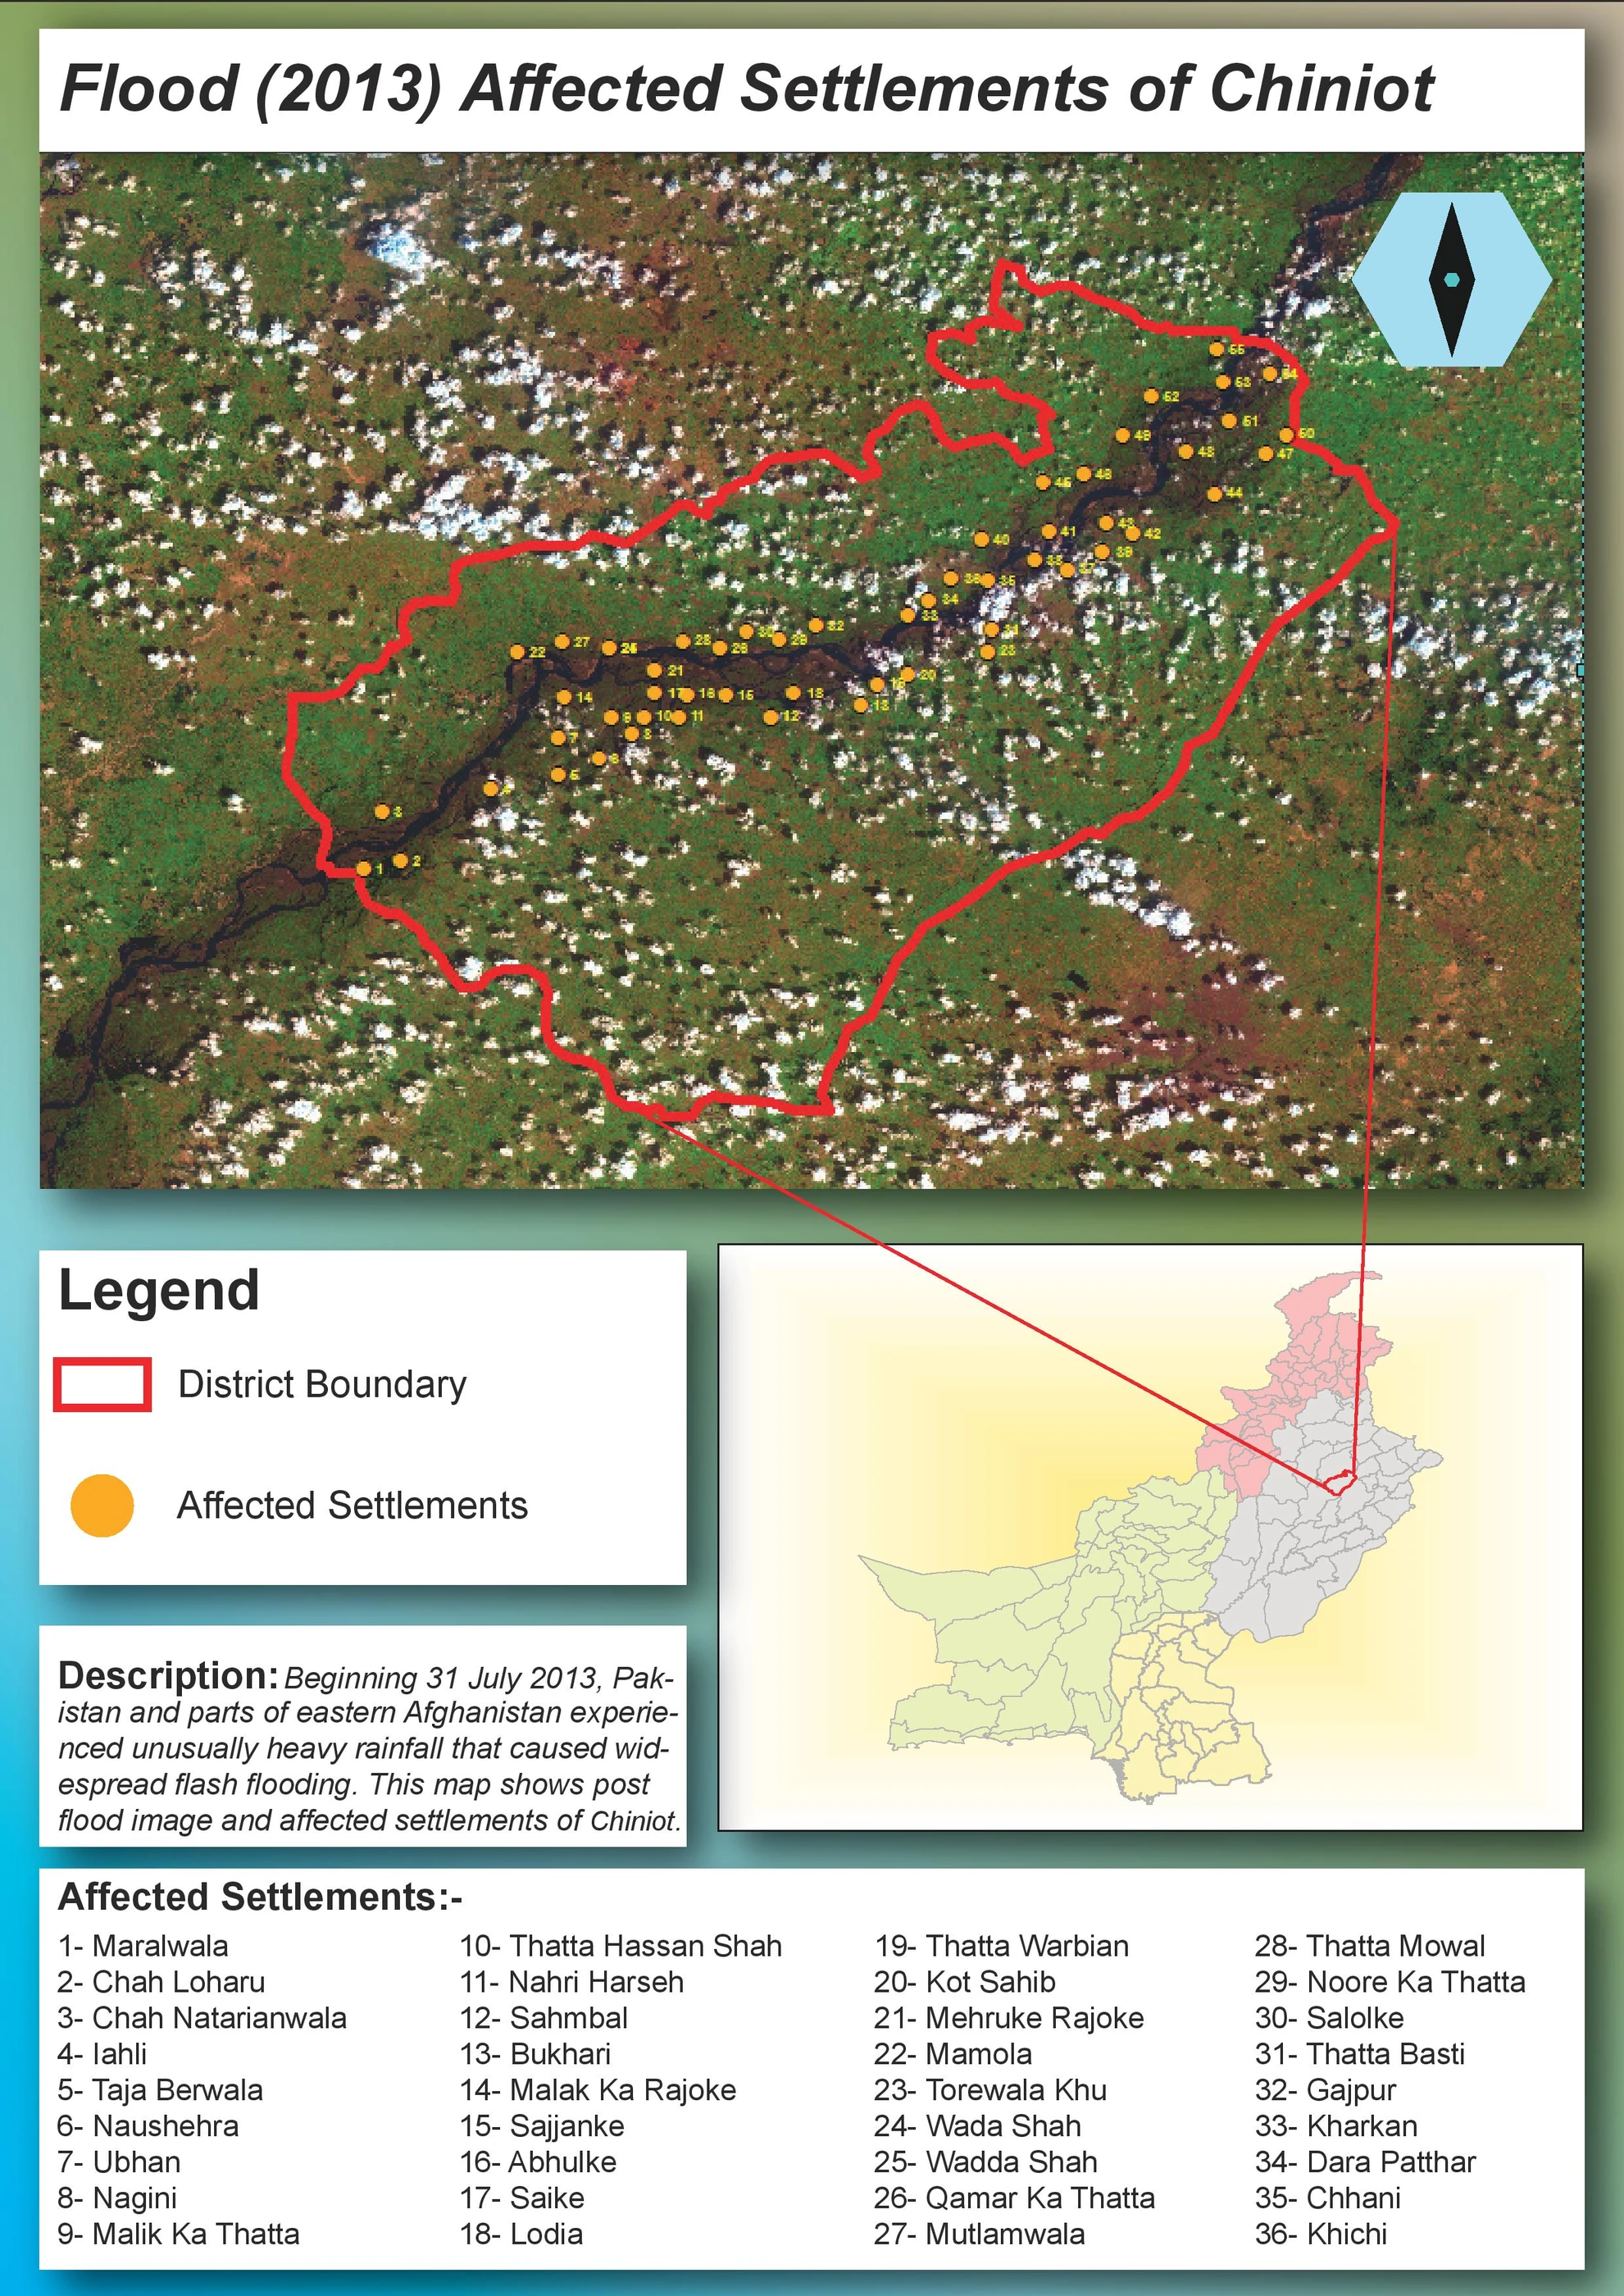
I mapped settlements affected by the 2013 Chiniot flood so their names and positions could be understood in relation to the river.
Read the project: Flood affected settlements of ChiniotCartography
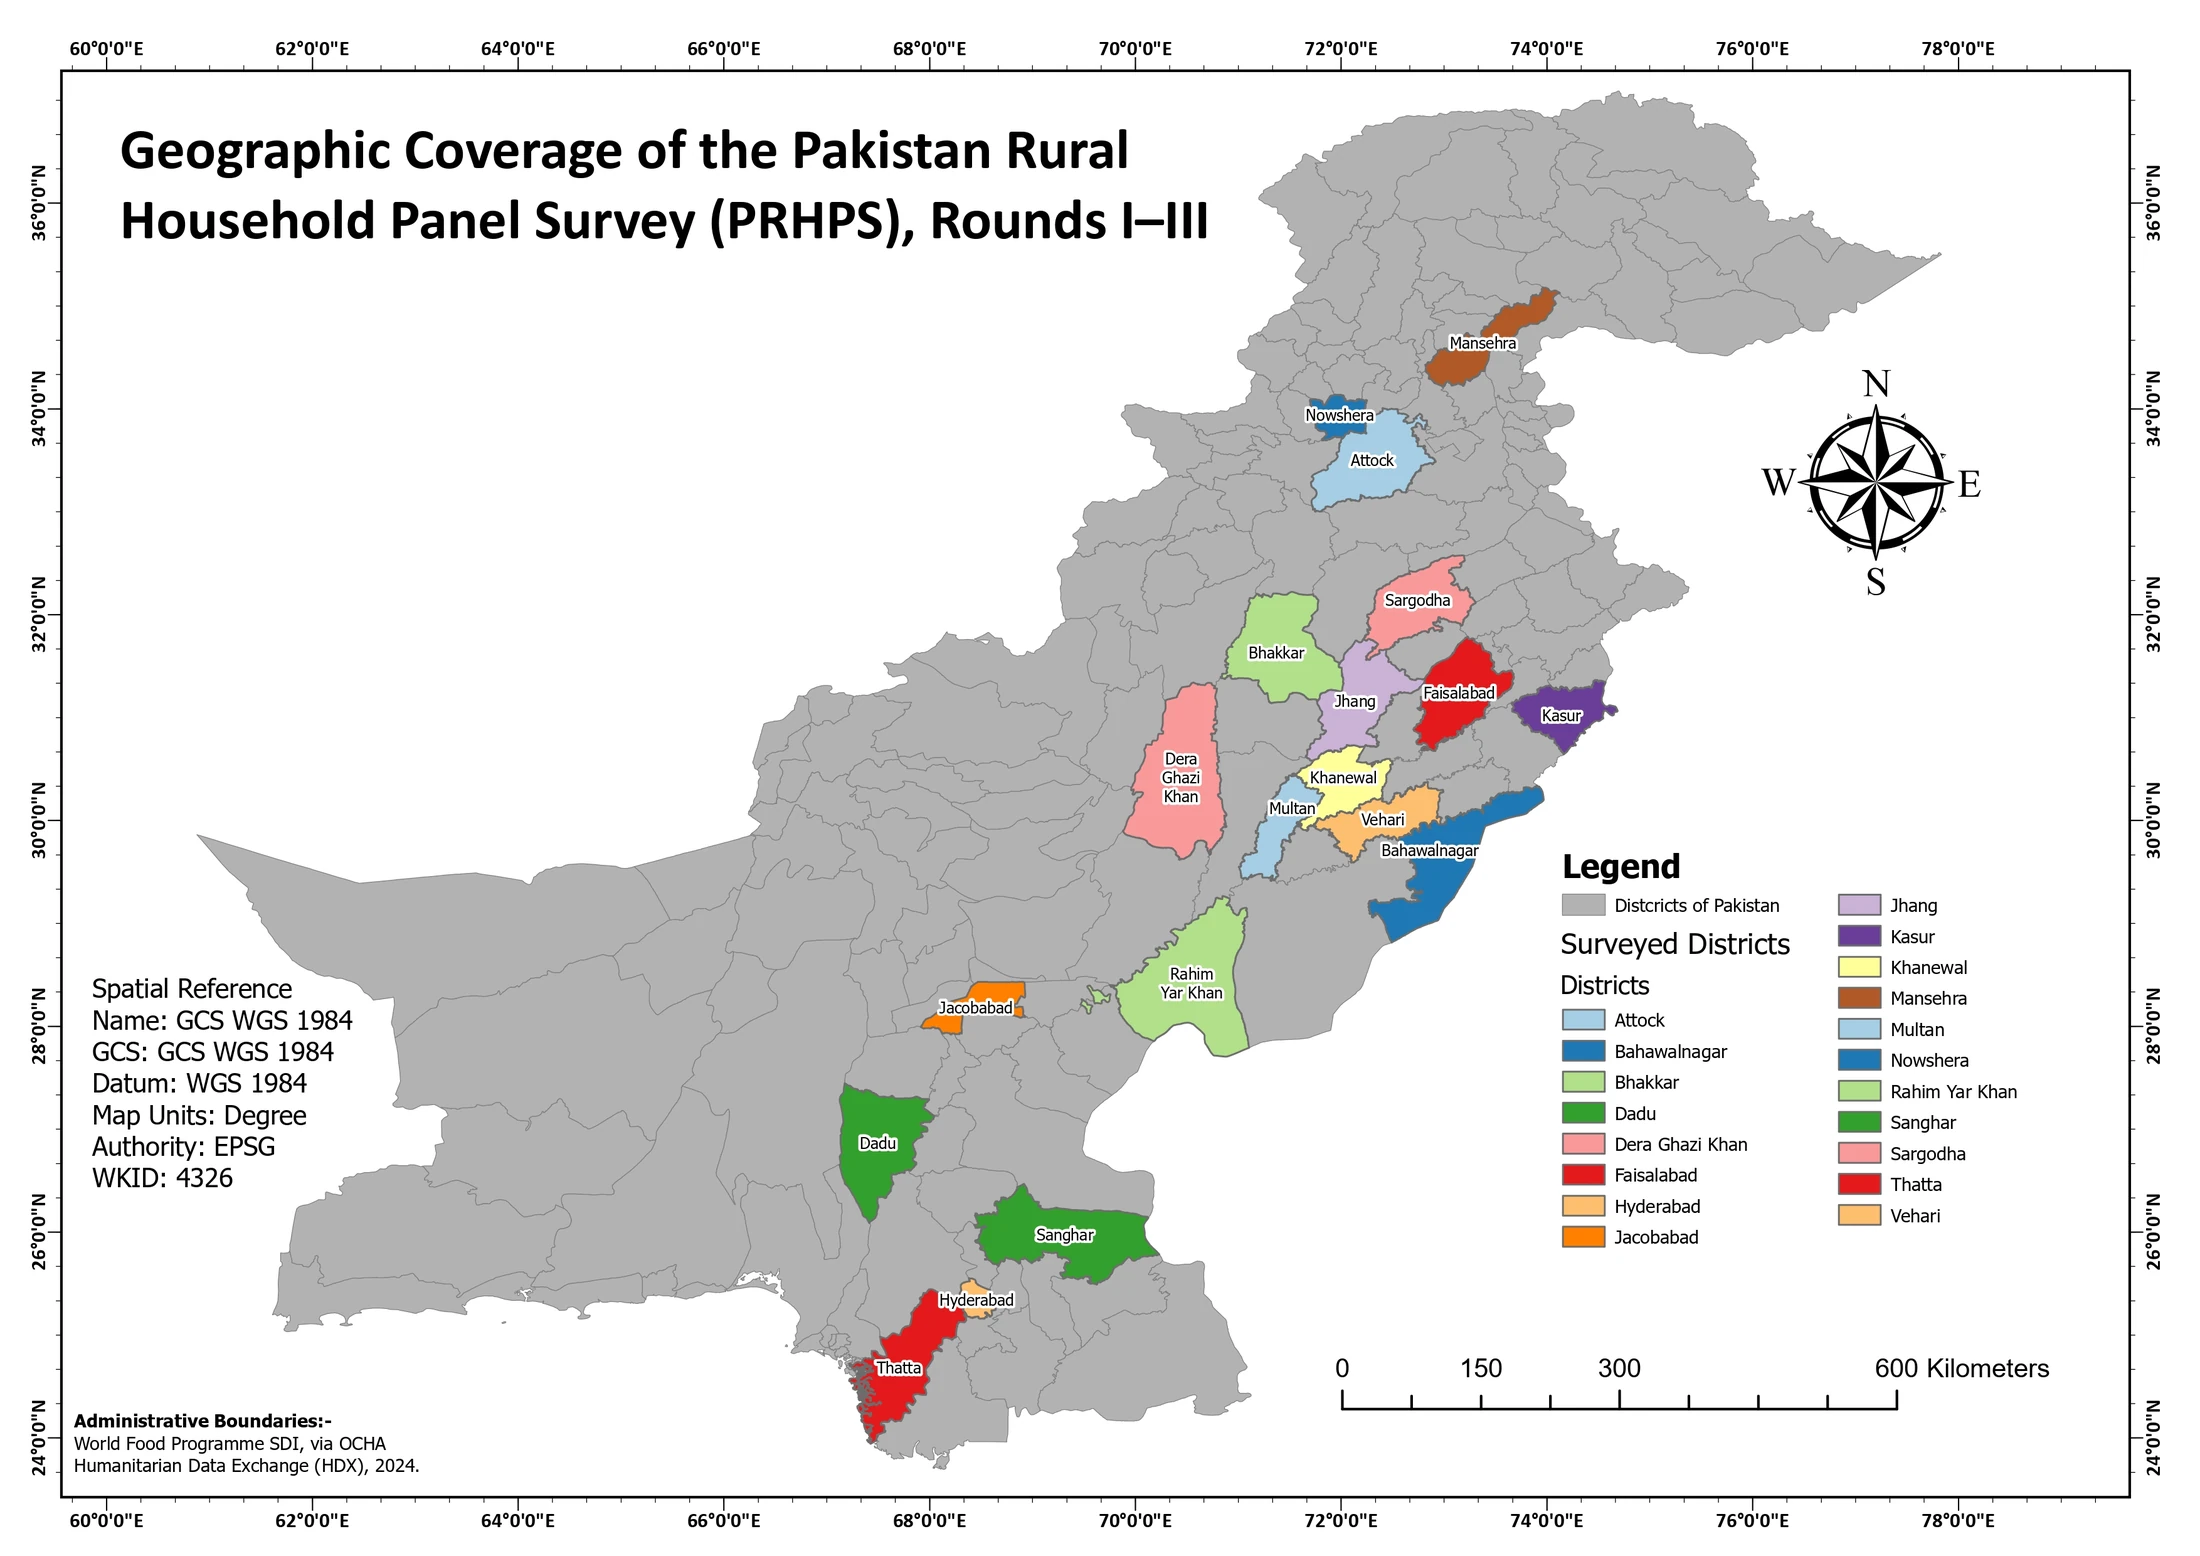
I mapped the districts included in the Pakistan Rural Household Panel Survey so readers could place its findings geographically.
Read the project: Pakistan household survey coverageCartography
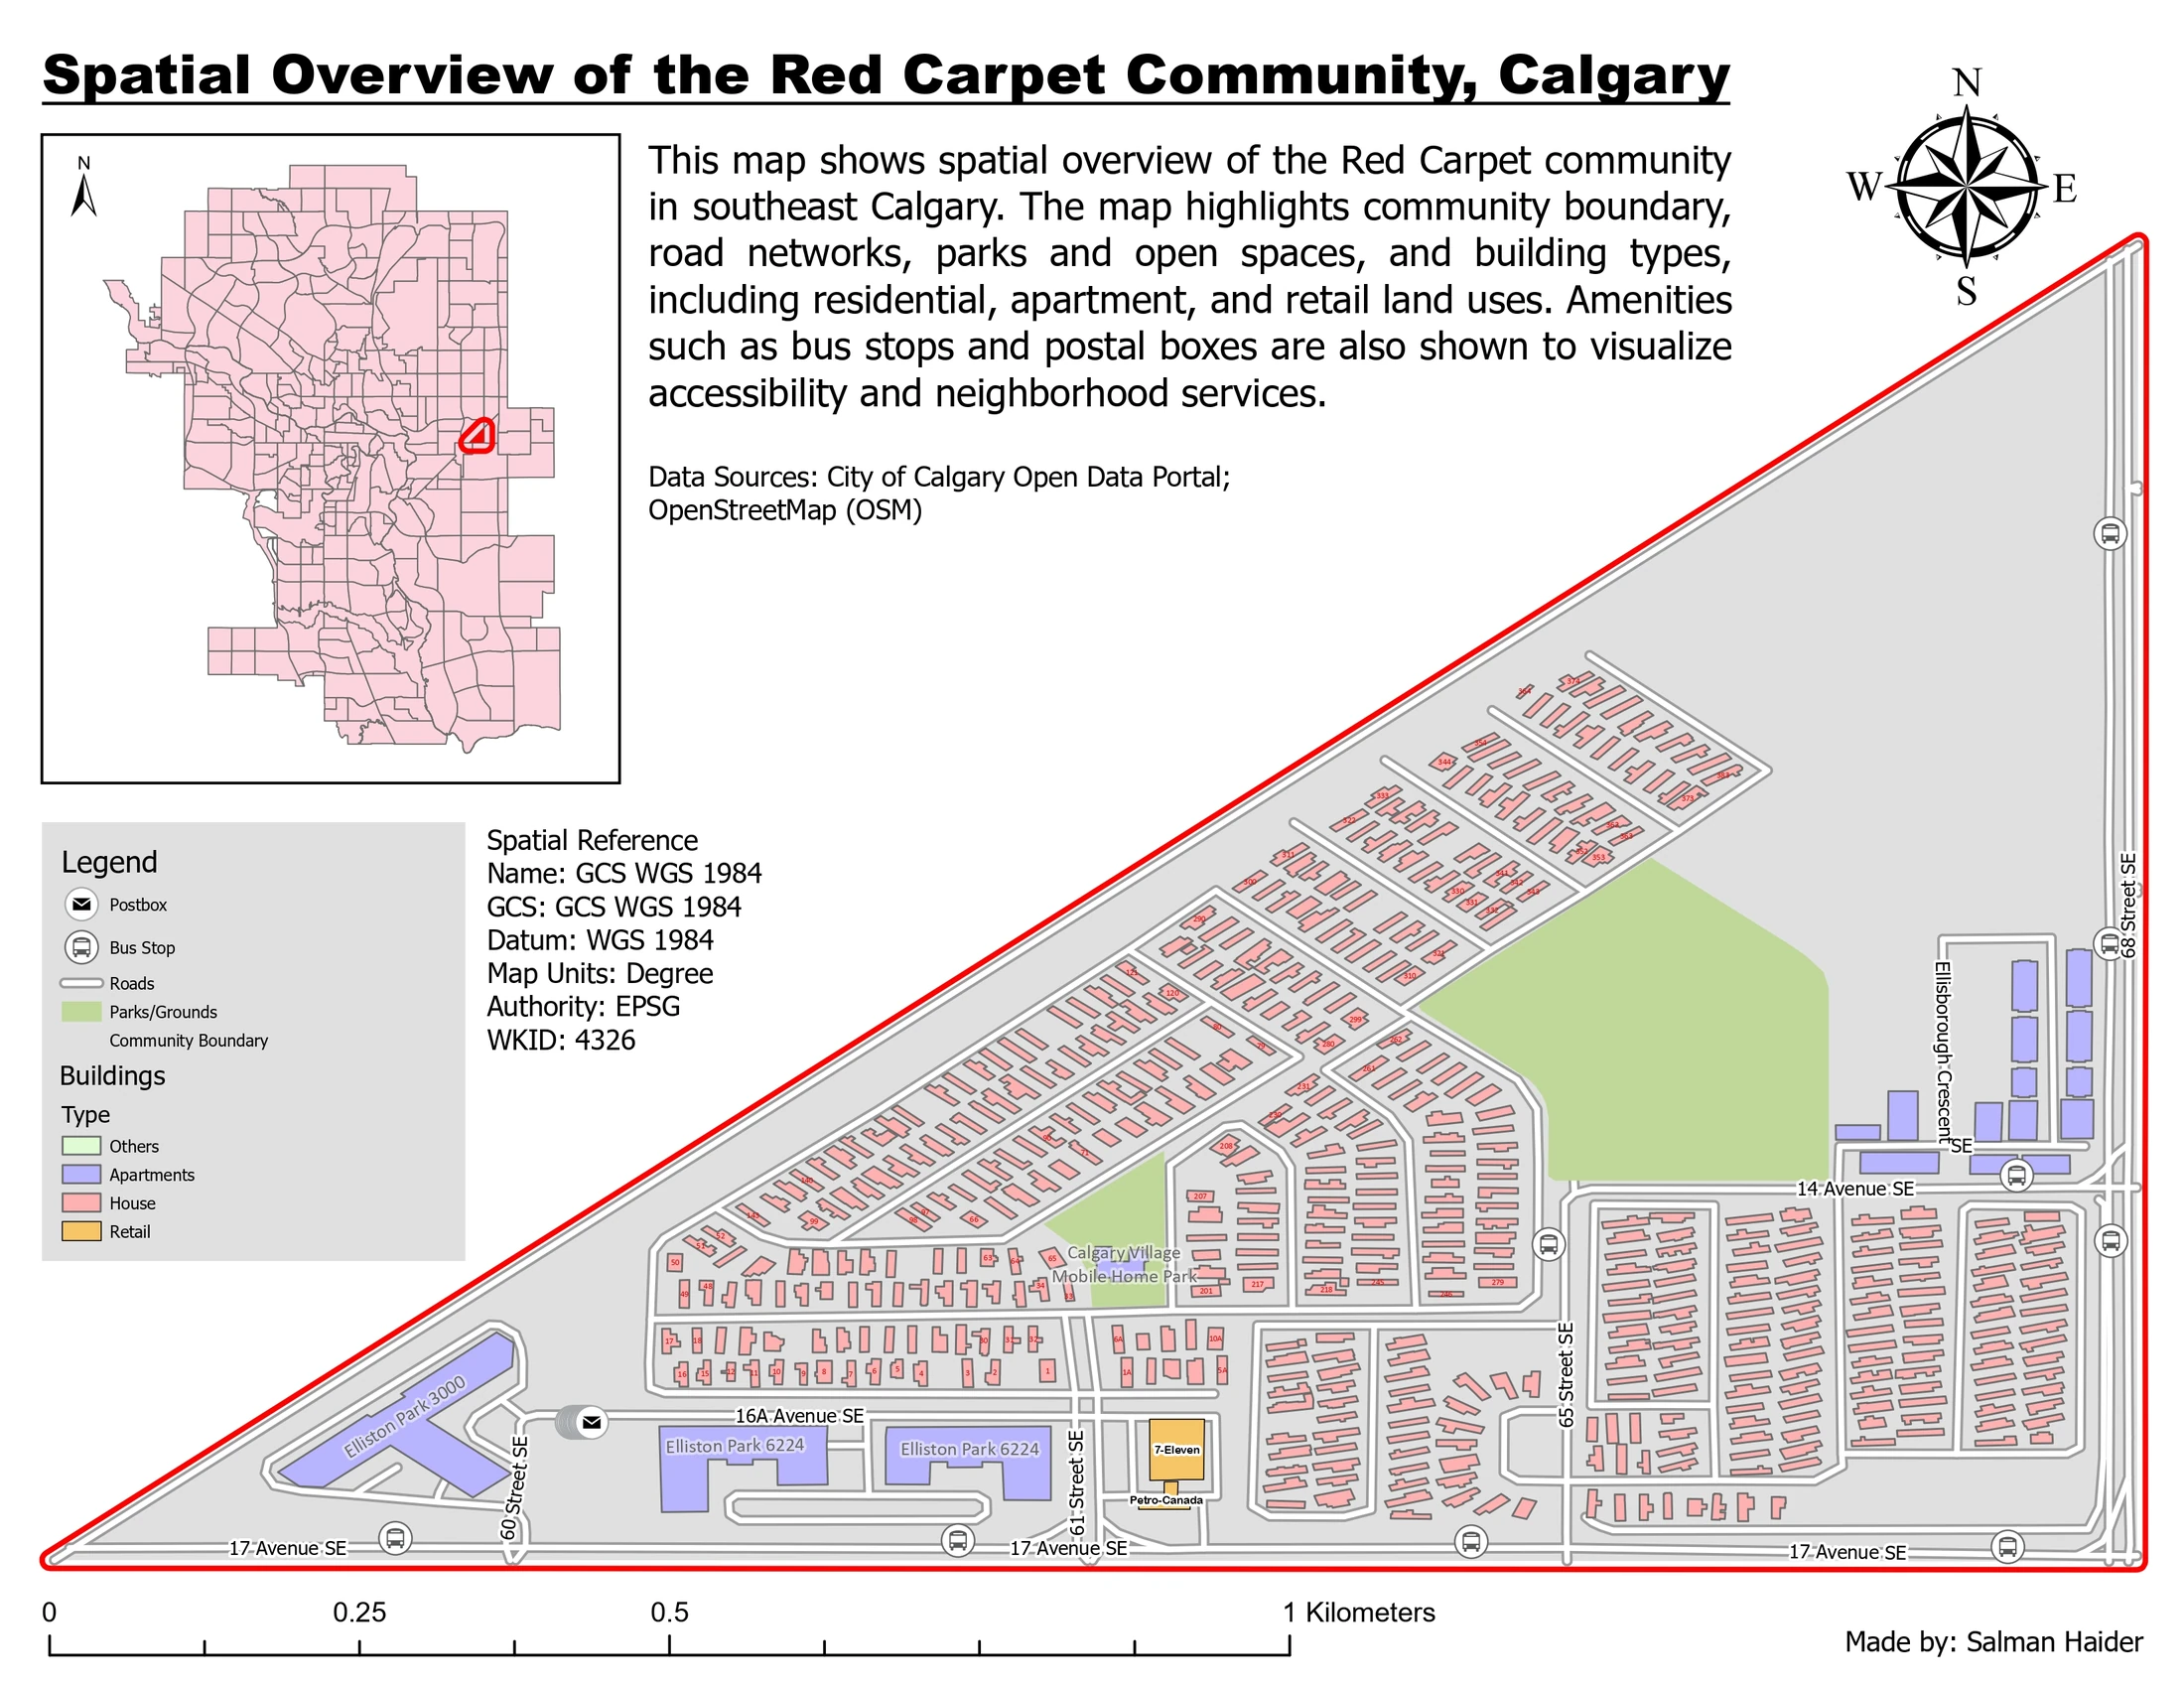
I mapped the Red Carpet community to show how its housing, open space and everyday services fit together.
Read the project: Red Carpet community mapCode & tools
A batch coordinate system check and reprojection script for preparing vector datasets to work together in NAD83 UTM Zone 12N.
Read the project: Spatial Reference CheckerCode & tools
A survey data tool that converts coordinate strings into mapped points and reports the outermost recorded species presence locations.
Read the project: CSV Survey PointsCode & tools
A small Python reader for checking the coverage and elevation range of an ASCII XYZ tile without loading all its rows into memory.
Read the project: ASCII XYZ LiDAR MetadataCartography
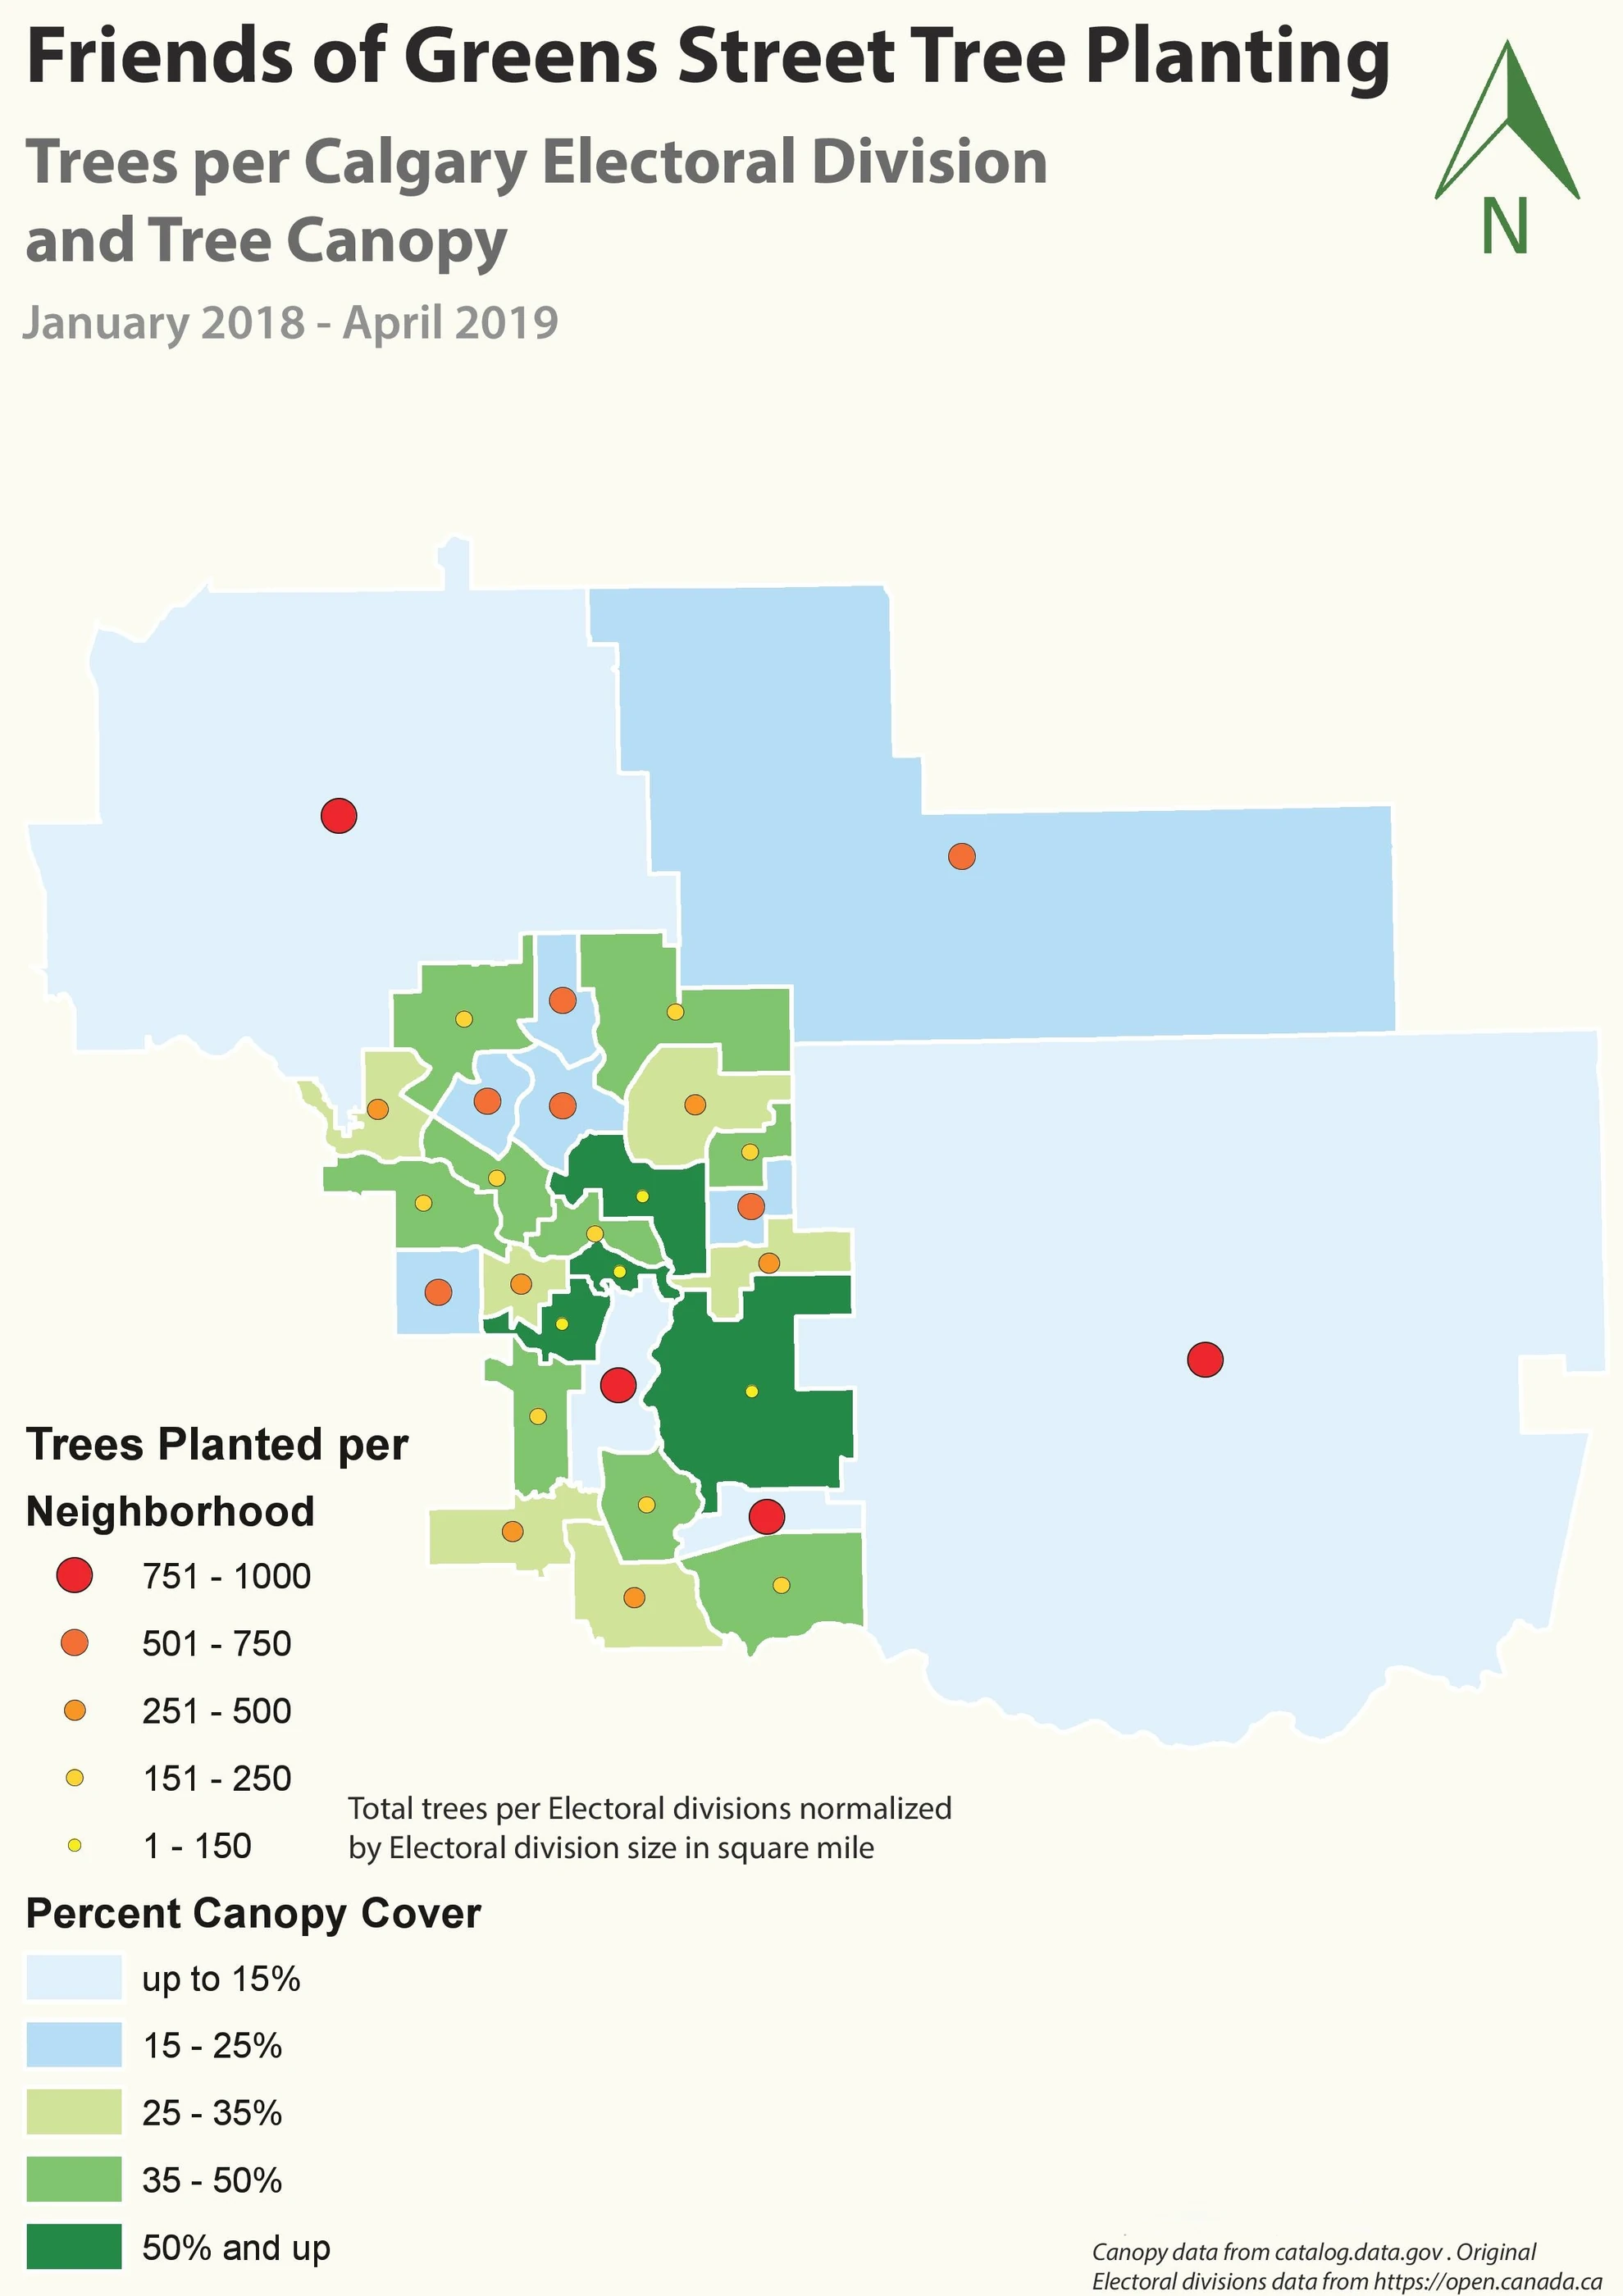
I mapped canopy cover alongside tree planting to show where recorded planting activity coincided with areas of limited cover.
Read the project: Calgary tree canopy and plantingCartography
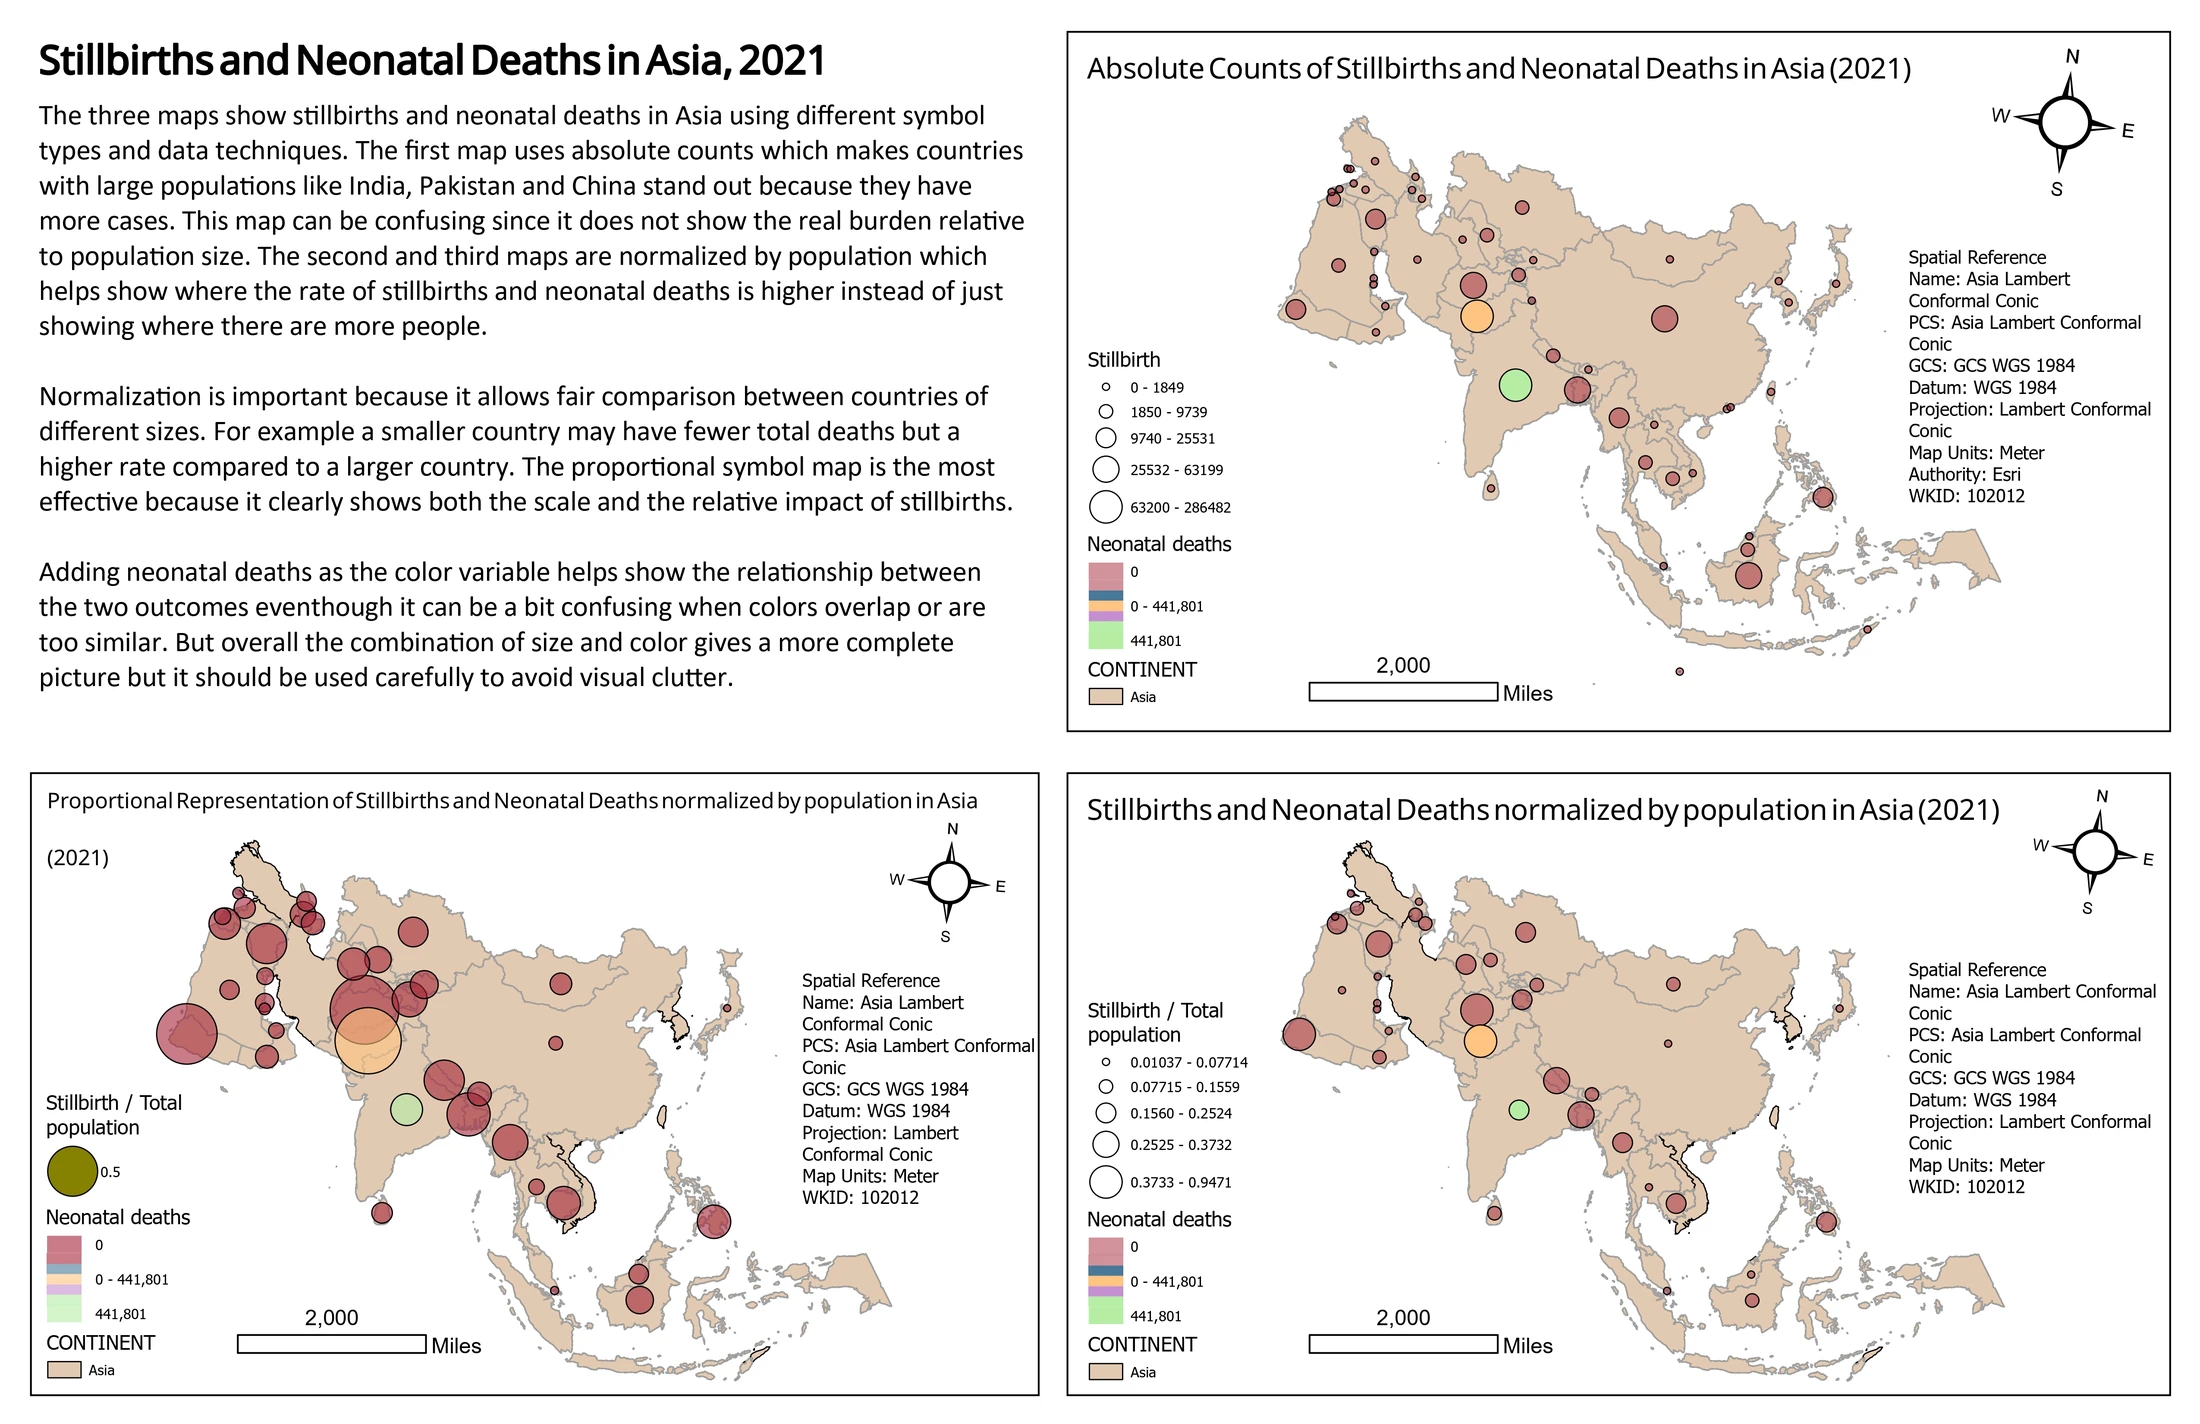
I explored how population size changes the way national stillbirth and neonatal death counts are read on a map.
Read the project: Stillbirths and populationI’m looking for GIS opportunities across Canada. You can reach me by email or on LinkedIn.